ENERGY: US Oil and Gas Rigs Down 2 on Week at 547: Baker Hughes
Oct-10 17:05
The US total oil and gas rig count was down 2 rigs on the week at 547 rigs, according to Baker Hughes.
- This puts total US oil and gas rigs down 39, or 6.7% on the year.
- See breakdown by type and week on week change:
- Oil: 418 (-4) - down 63 rigs, or 13.1% on the year.
- Gas: 120 (2) The highest since Aug. 22. This is up 19 rigs, or 18.8% on the year.
- Miscellaneous: 9 (0) - up 5 rigs on the year.
- Canada: 193 (3) - down 26 rigs, or 11.9% on the year.
Want to read more?
Find more articles and bullets on these widgets:
Historical bullets
ECB: Macro Since Last ECB: Growth - Domestic Demand Falls After Solid Run [1/2]
Sep-10 17:05
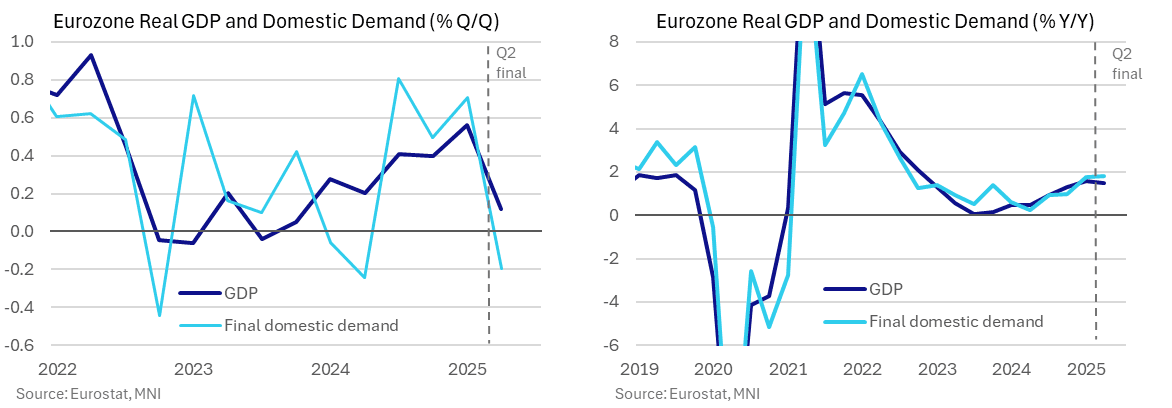
- Released shortly after the July ECB meeting, real GDP growth was a little better than analysts expected in the Q2 advance release at 0.1% Q/Q (cons 0.0) after a strong 0.6% Q/Q in Q1. Subsequent revisions haven’t materially altered this trend, if anything marginally on the stronger side with the Y/Y rounding up to 1.5% Y/Y.
- The recent final release put real GDP growth at 0.12% Q/Q in Q2, helped by a large +0.5pp coming from change in inventories whilst final domestic demand dragged -0.2pps for its joint largest decline since late 2022.
- The latter points to a marked cooling in underlying demand although it does follow a strong 0.7pp in Q1 and 0.6pp averaged in 2H24. As such, final domestic demand growth at 1.8% Y/Y remained a little above that of real GDP growth.
- The final report also showed that nominal GDP grew 0.8% Q/Q (vs 0.7% prior) and 4.0% Y/Y (vs 3.9% prior) in Q2. On a sequential basis, Q2 nominal growth was mostly inflationary – real growth was 0.1% Q/Q while GDP deflator growth was 0.7% Q/Q. However, on an annual comparison there is a growing contribution from real growth to nominal GDP, reflecting a gradual recovery in activity as ECB past rate cuts feed through the system (real growth was 1.5% Y/Y in Q2, versus deflator growth of 2.5% Y/Y).
- We calculate that profits contributed 0.6pp to annual nominal GDP growth after just 0.1pp in Q1 and negative contributions in the three quarters prior, with the impact of US tariffs on Eurozone exporters' profits key to watch in the quarters ahead.
US TSYS/SUPPLY: Review 10Y Auction Re-Open - Strong
Sep-10 17:04
- Treasury futures gap higher - extend highs (TYZ5 +7.5 at 113-18.5 vs. 113-20 high; 4.0321% yld) after the $39B 10Y note auction re-open (91282CNT4) stops through: drawing 4.033% high yield vs. 4.047% WI; 2.65x bid-to-cover vs. 2.35x prior.
- Peripheral stats: indirect take-up surges to 83.13% vs. 64.23% prior; direct bidder take-up at 12.66% from 19.61% prior; primary dealer take-up falls to new low of 4.21% vs. 16.87% prior.
- The next 10Y auction (re-open) is tentatively scheduled for October 8.
FED: US TSY 9Y-11M NOTE AUCTION: HIGH YLD 4.033%; ALLOTMENT 81.53%
Sep-10 17:02
- US TSY 9Y-11M NOTE AUCTION: HIGH YLD 4.033%; ALLOTMENT 81.53%
- US TSY 9Y-11M NOTE AUCTION: DEALERS TAKE 4.21% OF COMPETITIVES
- US TSY 9Y-11M NOTE AUCTION: DIRECTS TAKE 12.66% OF COMPETITIVES
- US TSY 9Y-11M NOTE AUCTION: INDIRECTS TAKE 83.13% OF COMPETITIVES
- US TSY 9Y-11M AUCTION: BID/CVR 2.65
Related bullets
Related by topic
Energy Data
US Natgas
TTF ICE
Asia LNG
Gas Positioning
Gasoil
Marine Oil
Oil Positioning (del)
OPEC
Freight
Jet Fuel
Gasoline
Fuel Oil
Diesel
Oil Options
US
Canada
Trending Top
Jun-26 16:22