US DATA: US-China Goods Deficit At Smallest Since At Least 2009
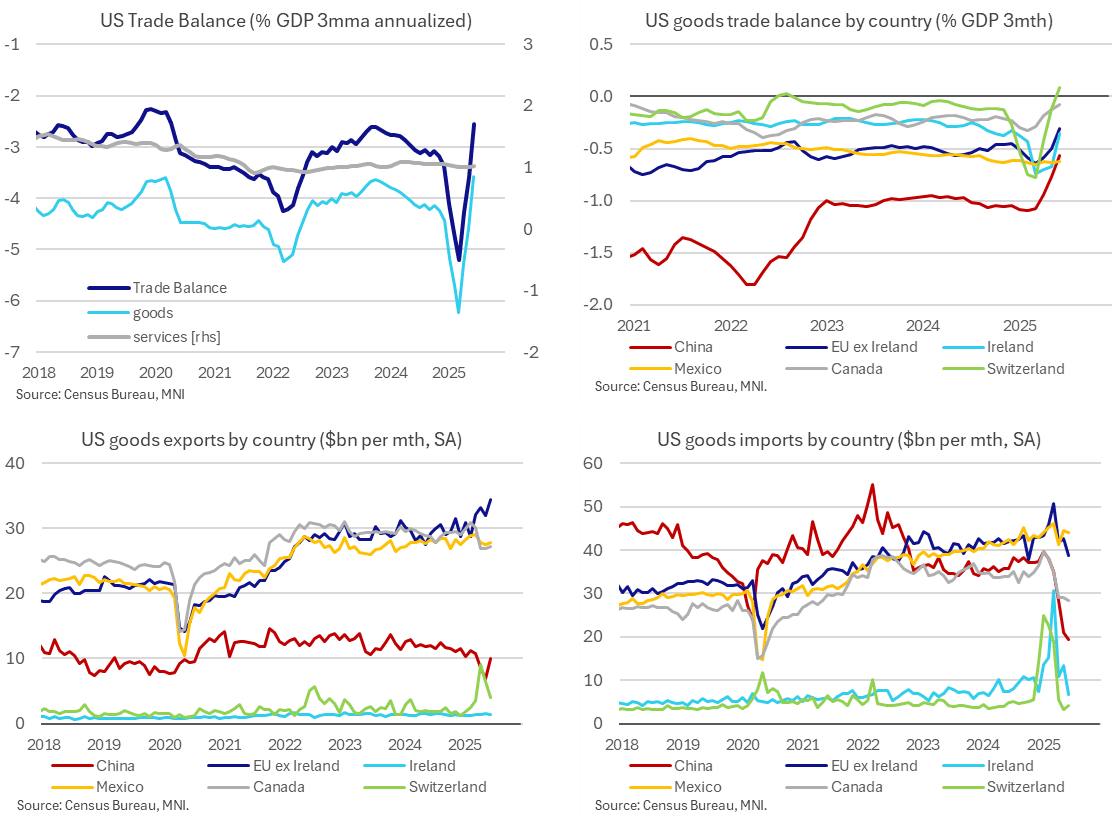
There weren’t any major surprises in the final goods & services trade data for June as last week’s surprisingly small goods deficit in the advance report had already set the tone. US trade deficits with both the EU and China narrowed further, with the goods deficit to China of 0.6% GDP in Q2 the lowest quarterly deficit since at least 2009.
- The goods & services trade deficit was close to expectations in June at $60.2bn (cons $61bn) after a near unrevised $71.7bn (initial $71.5bn) in May, after last week’s advance release just for goods had suggested similar.
- The goods & services deficit was equivalent to 2.5% GDP in Q2 after 5.2% GDP in Q1. That’s vs 3.4% GDP in Q4 or 3.1% GDP across 2024. Swings have come entirely from the goods deficit whilst the services surplus has been steady around 1.0% GDP.
- These low recent deficits are payback from the huge deficits of Dec and Q1 driven by tariff front-running, primarily gold and then pharmaceutical products.
- The goods deficit with the EU has narrowed to 0.7% of US GDP in Q2 vs 1.4% GDP in Q1 and 0.8% GDP in Q4, whereas the goods deficit with China has narrowed to 0.6% GDP in Q2 vs 1.1% GDP in Q1 and 1.0% GDP in Q4.
- Today’s details also show that June’s latest moderation in deficits, a surprise at the time of the advance release, was indeed driven by pharmaceutical imports (-36% M/M). At $17.1bn in June, pharma imports fell from $26.7bn in May as they continued to retrace from a huge peak of $50.2bn in March, having averaged $20.5bn in 2024 for context.
- Ireland has contributed heavily to these pharma flows (all imports from Ireland halved in June to $6.7bn) but imports from EU ex Ireland also eased from $42.7bn to $38.7bn (second lowest since mid-2022 for a nominal measure). This is down from $42.9bn in December.
- Imports from China saw a smaller decline on the month but have seen a more pronounced trend decline under the second Trump administration, most recently at $19.4bn in June after $20.9bn in May and $37.3bn in December.
- Exports have increased strongly over that period to the EU but less so for China. Exports to the EU increased to $35.8bn in June from $33.5bn in May and $30bn in Dec, whilst exports to China increased to $10.1bn from a particularly low $6.9bn in May (as trade flows slowed significantly in lagged response to policies that essentially halted trade between the two countries) and $11.5bn in Dec.
Want to read more?
Find more articles and bullets on these widgets:
Historical bullets
USDCAD TECHS: Trend Outlook Remains Bearish
- RES 4: 1.4111 High Apr 4
- RES 3: 1.4016 High May 12 and 13 and a key resistance
- RES 2: 1.3920 High May 21
- RES 1: 1.3674/3776 20- and 50-day EMA values
- PRICE: 1.3607 @ 16:12 BST Jul 4
- SUP 1: 1.3557 Low Jul 03
- SUP 2: 1.3540 Low Jun 16 and the bear trigger
- SUP 3: 1.3503 1.618 proj of the Feb 3 - 14 - Mar 4 price swing
- SUP 4: 1.3473 Low Oct 2 2024
The trend needle in USDCAD points south and this week’s move down reinforces current conditions. S/T gains between Jun 16 - 23 appear to have been corrective. Key support and the bear trigger is 1.3540, Jun 16 low. Clearance of this level would resume the downtrend and open 1.3503, a Fibonacci projection. Pivot resistance is at the 50-day EMA, at 1.3776. A clear break of this average would signal scope for a stronger recovery.
AUDUSD TECHS: Bull Cycle Remains In Play
- RES 4: 0.6700 76.4% retracement of the Sep 30 ‘24 - Apr 9 bear leg
- RES 3: 0.6688 High Nov 7 ‘24
- RES 2: 0.6603 High Nov 11 ‘24
- RES 1: 0.6590 High Jul 01
- PRICE: 0.6548 @ 16:05 BST Jul 04
- SUP 1: 0.6521 20-day EMA
- SUP 2: 0.6468/6373 50-day EMA / Low Jun 23 and a reversal trigger
- SUP 3: 0.6357 Low May 12
- SUP 4: 0.6275 Low Apr 14
The trend set-up in AUDUSD remains bullish and the pair is holding on to its recent gains. The latest break higher maintains the bullish price sequence of higher highs and higher lows, the definition of an uptrend. Moving average studies are in a bull-mode position, highlighting a dominant uptrend. Sights are on 0.6603 next, the Nov 11 2024 high. Key short-term support has been defined at 0.6373, the Jun 23 low.
EURJPY TECHS: Northbound
- RES 4: 171.88 High Jul 19 ‘24
- RES 3: 171.28 1.382 proj of the Feb 28 - Mar 18 - Apr 7 price swing
- RES 2: 171.09 High Jul 23 ‘24
- RES 1: 170.61 High Jul 03
- PRICE: 170.22 @ 16:04 BST Jul 04
- SUP 1: 169.04 Low Jul 02
- SUP 2: 167.87 20-day EMA
- SUP 3: 167.13 Low Jun 20
- SUP 4: 165.66 50-day EMA
EURJPY traded higher on Thursday resulting in a print above 170.47, the 76.4% retracement of the Jul 11 - Aug 5 sell-off. A clear break of this price point would strengthen bullish conditions and signal scope for extension. This would open 170.28 next, a Fibonacci projection. The trend is overbought, a pullback would unwind this condition. Support to watch lies at 167.87, the 20-day EMA.