US FINANCIALS: UBS Capital compromise plan gains support from key party
Jan-08 16:30
UBS capital compromise plan gets support of Swizterland's key political party, SVP. It increases odd...
Want to read more?
Find more articles and bullets on these widgets:
Historical bullets
SOFR OPTIONS: Large Late Morning Call Trades
Dec-09 16:24
- +20,000 SFRF6 96.37 puts 1.5-1.75 over 96.50/96.75 call spds ref 96.41
- Update pit/screen: -58,000 SFRF6 96.56/96.68 call spds, 1.0 ref 96.405 to -.41 offered
- -8,000 SFRZ5 96.18/96.25/96.372x3x1 broken call flys, 7.5 vs. 96.2675/0.21%
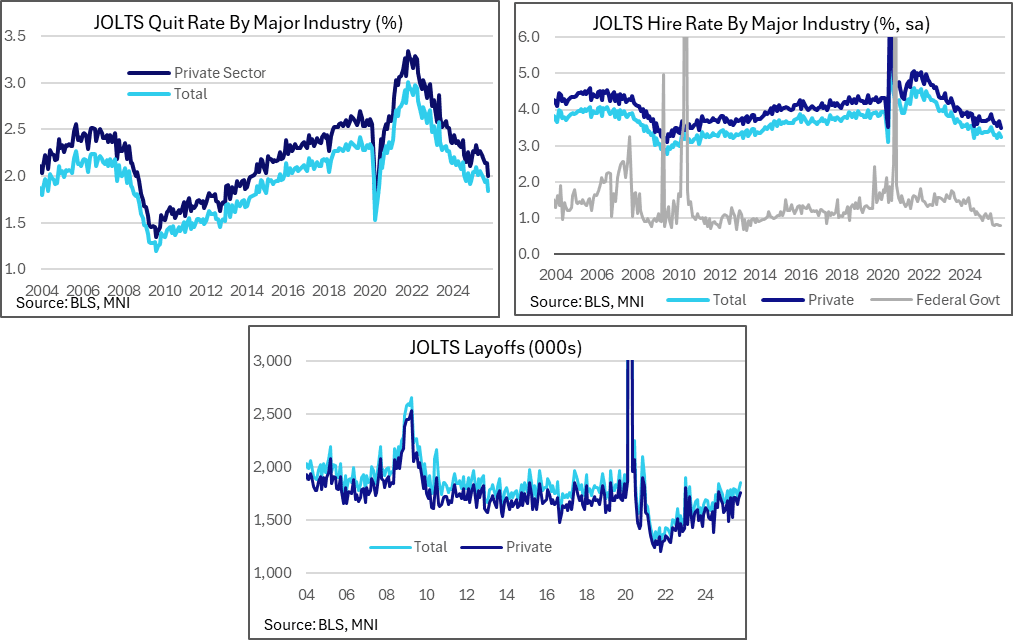
US DATA: … But Other JOLTS Indicators Read Clearly Softer
Dec-09 16:02
The quits rate fell further in October to its lowest since 2014 when excluding two pandemic months of 2020 and the hires rate broadly confirmed August’s decline to lows since 2021.
- The quits rate was reported at 1.8%, down from 1.96 in September and 1.94 in August.
- We have taken this October quits rate from the 1.d.p value reported by the BLS rather than our usual unrounded calculations which use the usually already known level of payrolled employment in the month.
- Of course, we will only officially know the October level of payrolls with the delayed November report on Dec 16. It’s unclear whether the BLS has used what it currently estimates to have been payrolls employment in October or whether it just references September instead (the latter would yield a 1.84 quit rate so it would just hold).
- Those details aside, this 1.8% quit rate is its lowest since 2014 outside of Apr and May 2020 pandemic months, clearly pointing to greater caution in the labor market. It steps below a range of 1.9-2.1% seen since mid-2024.
- The hires rate meanwhile broadly confirmed a shift to new recent lows, reported at 3.2% in October (it would be 3.23 assuming zero payrolls growth since September) for close to the 3.21 in August that had been its lowest since Sep 2021 when excluding the pandemic-hit Apr 2020. This briefly increased to 3.36% in September.
- Finally, layoffs increased further to 1854k in October and 1781k in September after the 1725k in August to hit the highest since early 2023. It paints a weaker picture than that painted by higher frequency weekly jobless claims data although is a less severe increase than the surge in layoff announcements from back in the October Challenger report.
- Historical context gives a mixed read for these JOLTS layoffs. The 1854k in October has only just pushed back above the 1818k averaged in 2019, a period when the labor market was historically tight, yet layoffs were reported a similar levels for many years before that when the labor market wasn't as robust.
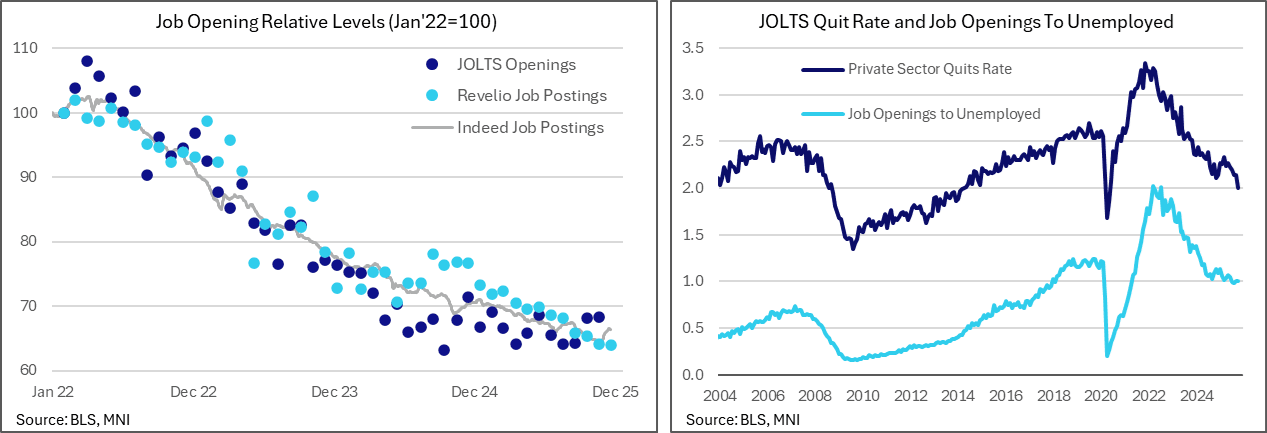
US DATA: Much Higher Than Expected JOLTS Job Openings…
Dec-09 16:01
Job openings in the delayed BLS JOLTS report were far higher than expected in October. There was rare relative outperformance to alternative sources such as Indeed or Revelio that had helped form expectations of a modest steady decline compared to August data last released just prior to the government shutdown.
- Job openings were far higher than expected in October at 7670k (sa, cons 7117k) and were also higher than presumably expected at 7658k in September data also released today.
- It’s a marked increase compared to the 7227k seen in August shortly before the government shutdown. As the chart below shows, the size of this deviation from alternate indicators such as Indeed or Revelio isn’t new but JOLTS being relatively higher than them certainly is.
- It saw the ratio of openings to unemployed rise to 1.01 in September, more than reversing its dip from 1.00 to 0.98 in August (a fresh low and technically its first sub-1.0 since Apr 2021). This increase was limited by September’s already known large increase in unemployment.
- It remained at 1.01 in October assuming the same level of unemployment (there won’t ever be household survey details for October), leaving four months averaging 1.00 for a further steady moderation from the 1.04 averaged in Feb-Jun. Powell in September noted the ratio remained near 1 as a part of a number of other labor market indicators that remain broadly stable, but we assume greater sensitivity if this starts falling materially lower. For context, it averaged 1.2 in 2019 and 1.0 in 2017-18.