LOOK AHEAD: Thursday Data Calendar: Import/Export, Weekly Claims, Fed Speakers
* US Data/Speaker Calendar (prior, estimate). All times ET * 05/14 0800 Fed Gov Miran Bloomberg TV *...
Want to read more?
Find more articles and bullets on these widgets:
Historical bullets
OPTIONS: Larger FX Option Pipeline
- EUR/USD: Apr15 $1.1610(E1.4bln), $1.1650-60(E2.0bln), $1.1750(E1.9bln), $1.1800(E1.4bln); Apr16 $1.1660-70(E2.3bln), $1.1700(E1.3bln), $1.1735-50(E1.7bln)
- USD/JPY: Apr15 Y158.00($1.1bln), Y158.85($1.2bln), Y160.00($1.2bln); Apr16 Y156.90-00($1.5bln), Y158.40($1.2bln), Y161.00($1.1bln)
- AUD/USD: Apr15 $0.6900(A$1.6bln), $0.7125(A$1.4bln)
- USD/CNY: Apr16 Cny6.8660($1.3bln)
US 10YR FUTURE TECHS: (M6) Support Remains Exposed
- RES 4: 112-16 61.8% retracement of the Mar 2 - 27 bear leg
- RES 3: 112-07 High Mar 18
- RES 2: 111-31 50.0% retracement of the Mar 2 - 27 bear leg
- RES 1: 111-19+ 50-day EMA & High Apr 08
- PRICE: 110-31+ @ 11:32 BST Apr 13
- SUP 1: 111-22+ Low Apr 13
- SUP 2: 110-16/109-24 Low Apr 2 / Low Mar 27 and the bear trigger
- SUP 3: 109-22+ 1.764 proj of the Mar 10 - 13 - 18 price swing
- SUP 4: 109-12 2.000 proj of the Mar 10 - 13 - 18 price swing
Recent gains in Treasuries appear to have been a correction. Trend signals remain bearish - moving average studies in bear-mode position highlighting a dominant downtrend. Support to watch is 110-16, the Apr 2 low. A break would be bearish. For bulls, the next important resistance at 111-19+, the 50-day EMA. A clear break of this average is required to signal scope for a stronger recovery and open 111-31, a Fibonacci retracement.
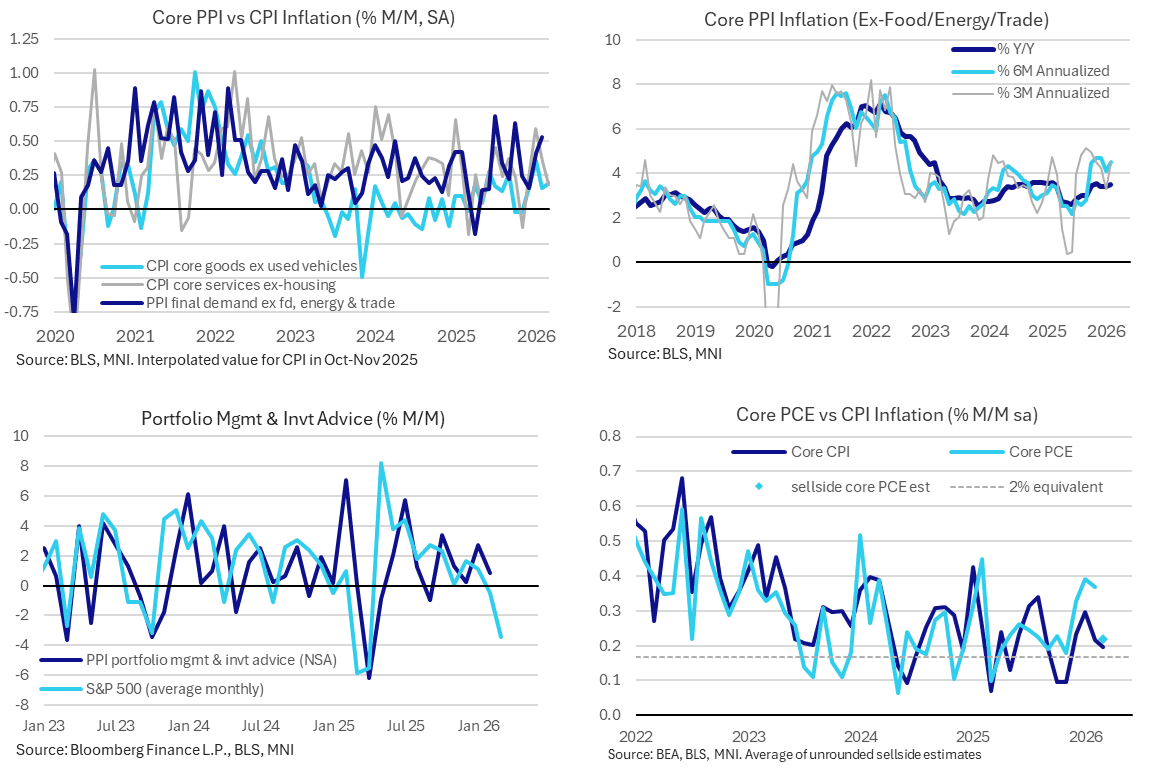
US PREVIEW: March PPI - Energy Seen Boosting Headline and Less So Core
The March PPI report on Tuesday headlines US data this week. It will as always be watched for i) broad input cost pressures, this time as energy components jump, and ii) specific details to update core PCE tracking.
- i) Bloomberg consensus looks for headline PPI inflation to accelerate to 1.1% after 0.7% M/M, boosted by strong increases in energy prices, whilst our preferred measure of core PPI (ex food, energy & trade services) is seen at 0.4% after 0.5% M/M in Feb and 0.4% M/M Jan.
- February's PPI report showed hotter-than-expected price pressures across multiple categories, with higher energy costs of some additional note given that they came ahead of the March price spike. Worryingly for future consumer inflation dynamics, momentum in core prices appeared to be picking up, with several gauges at or above the high end of the ranges seen over the past 4 years.
- JPM write that the March “national PMI and ISM manufacturing and services surveys were synonymous in their message of rising prices, with qualitative comments noting shipping challenges and higher supplier prices owing to the war.”
- However, core CPI details for March saw relatively few signs of initial spillover from high energy prices.
- Generally speaking, the trend difference between PPI and CPI core goods rates over the past 2-3 years shows reduced pricing power compared to that seen through 2021/22 but with still sizeable passthrough to core services.
- ii) On the core PCE-specific details, portfolio management & investment advice could have pulled back after five consecutive monthly declines (Nomura estimate -1.3% M/M) but airfares will be watched as jet fuels jumped along with scope for increases in physician service prices.
- For now, core PCE tracking for March looks close to the 0.20% M/M seen for core CPI, with unrounded estimates we’ve seen so far averaging 0.22% M/M (range 0.19-0.27) after three months averaging a strong 0.36% M/M. Final estimate tweaks will then come after import prices on Wed before the actual PCE release back in its end-of-month slot on Apr 30.