SWEDEN: Surveys Suggest Economy Started The Year On Solid Footing
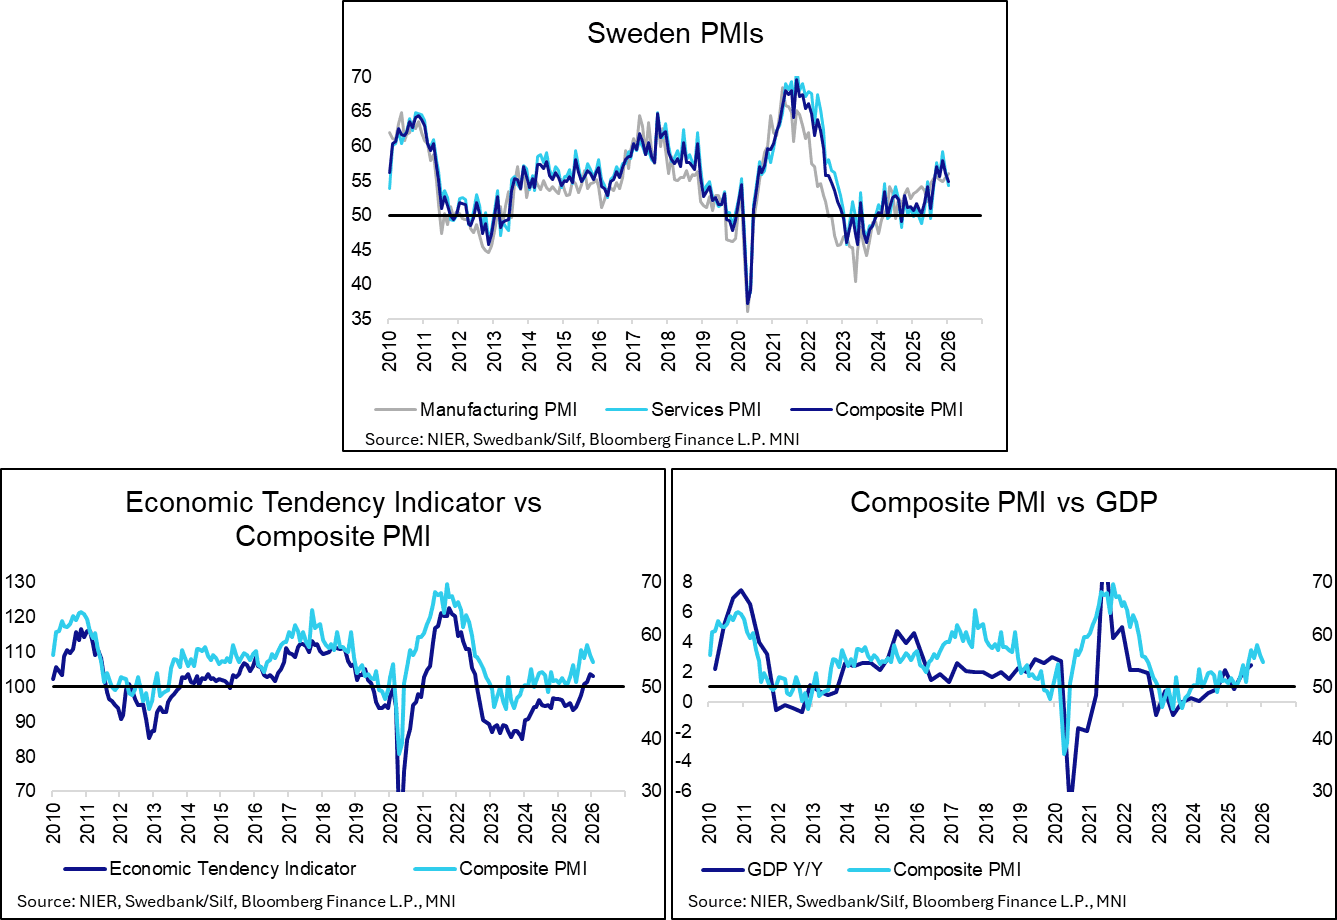
The Swedish January services PMI was below the three analyst forecasts submitted to Bloomberg (range 56.5-57.0), but at 54.3 (vs 56.3 prior) was still the sixth consecutive month in expansionary territory. That left the composite PMI at 54.8 (vs 56.0 prior). Overall, the January PMI and Economic Tendency Indicator surveys suggest the Swedish economic started the year on a solid footing, consistent with Riksbank and analyst expectations.
- In January, services production and new orders remained above the neutral 50 level, at 56.1 and 55.2 respectively.
- Employment hovers just below 50 at 49.7 (vs 49.8 prior).
- There was a fourth consecutive rise in supplier input prices (60.1 vs 59.5 prior), but the Riksbank will likely place more stock in actual inflation outcomes and downside risks from the stronger SEK. January flash inflation is due on Friday.
Want to read more?
Find more articles and bullets on these widgets:
Historical bullets
US TSY FUTURES: TU Sold
TUH6 5K given at 104-12.25, helps limit the uptick from Friday lows in wider core global FI markets.
WTI TECHS: (G6) Bearish Trend Signals Dominate
- RES 4: $70.16 - High Jun 23 and a key medium-term resistance
- RES 3: $64.97 - High Sep 26
- RES 2: $61.25 - High Oct 24 and a key resistance
- RES 1: $58.47 - 50-day EMA
- PRICE: $56.84 @ 07:24 GMT Jan 5
- SUP 1: $54.89 - Low Dec 16
- SUP 2: $54.71 - Low Apr 9 and a key support
- SUP 3: $53.77 - 1.764 proj of the Jul 30 - Aug 13 - Sep 26 price swing
- SUP 4: $52.27 - 2.000 proj of the Jul 30 - Aug 13 - Sep 26 price swing
The trend condition in WTI futures remains bearish and recent gains are considered corrective. Moving average studies are in a bear-mode position, highlighting a dominant downtrend. A resumption of the downtrend would signal scope for a move towards $53.77, a Fibonacci projection. Key short-term resistance is $61.25, the Oct 24 high. First resistance is at $58.47, the 50- day EMA.
EURJPY TECHS: Trading Closer To Its Recent Highs
- RES 4: 186.41 2.618 proj of the Jul 31 - Sep 29 - Oct 2 price swing
- RES 3: 186.10 Bull channel top drawn from the Feb 28 low
- RES 2: 185.77 2.5000 proj of the Jul 31 - Sep 29 - Oct 2 price swing
- RES 1: 184.92 High Dec 22
- PRICE: 183.55 @ 07:29 GMT Jan 5
- SUP 1: 183.17 20-day EMA
- SUP 2: 182.25 Low Dec 19
- SUP 3: 181.57 Low Dec 17
- SUP 4: 181.08 50-day EMA
The trend structure in EURJPY remains bullish and the cross is trading closer to its recent highs. A fresh trend high on Dec 22 confirms a resumption of the primary uptrend. Sights are on 186.10, the top of a bull channel drawn from the Feb 28 low. This level also represents a key resistance point. On the downside, support to watch lies at 183.17, the 20-day EMA. A breach of it would signal the start of a corrective cycle.