GLOBAL MACRO: Ships To US Normalising But Frontloading May Reduce H2
Jun-11 01:31
Container ship tracking data suggest that trade flows have picked up again following the April 2 US announcement of extensive reciprocal tariffs as traders take advantage of the 90-day delay which expires July 8. Most major routes to the US have seen the number of vessels return to around average. Trade talks are ongoing and will determine if this stays the case in Q3 but the inventory build ahead of deadlines may drive a reduction in global trade flows in H2 anyway.
- Bloomberg’s container ship count data covers the number of loaded ships leaving for the US. Looking at the 30-day average, shipments from Europe, Korea, Taiwan and Japan rose over Q1 to beat initial US deadlines, and then all ex Japan declined over April.
Bloomberg container ship count 30-day moving average
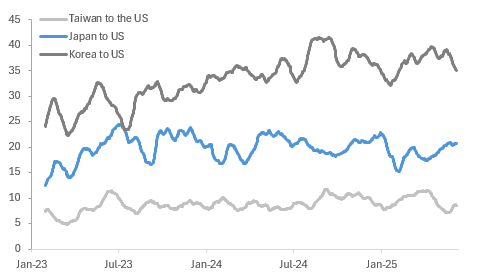
Source: MNI - Market News/Bloomberg Finance L.P.
- Interestingly cargos leaving China had been trending down from September to end-March signalling no intention to frontload exports. However, then they rose sharply to mid-April before plummeting again in line with the escalation in the US-China trade spat but at the end of April before the US-China Geneva meeting announcement on May 11 they rose sharply possibly on a willingness to absorb tariffs or expectations that they would be delayed or reduced before the ships arrived.
Bloomberg container ship count
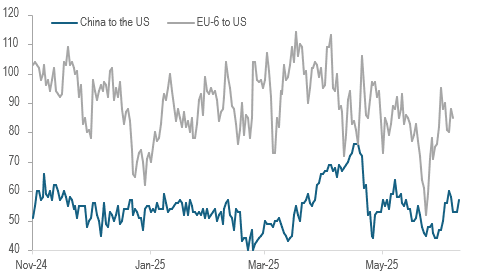
Source: MNI - Market News/Bloomberg Finance L.P.
- In June, the number of ships departing China for the US is around 5 above the average from 2023 to end-January 2025 suggesting a normalisation of trade flows or some frontloading. The number from Japan is in line with this average signalling expectations that a deal will be agreed. Taiwan is one ship above average this month and Korea is two.
- While European ships to the US are off the May 23 low, in June they were still 10 vessels below average. There was significant European frontloading in Q1, as seen by Irish pharmaceutical exports to the US, and this below-par recovery may reflect that.
Want to read more?
Find more articles and bullets on these widgets:
Historical bullets
MNI: CHINA PBOC CONDUCTS CNY43 BLN VIA 7-DAY REVERSE REPO MON
May-12 01:25
- CHINA PBOC CONDUCTS CNY43 BLN VIA 7-DAY REVERSE REPO MON
CNH: USD/CNY Fixing Edges Down But Remains Within Recent Ranges
May-12 01:24
The USD/CNY fix printed at 7.2066, versus a BBG market consensus of 7.2441.
- Today's fixing is down from Friday's outcome of 7.2095, but we remain within recent ranges. The recent low for the fixing coming in at 7.2005.
- The fixing error was little changed at -375pips.
- USD/CNH spot was last near 7.2250, up around 0.20% versus end NY levels from Friday. We haven't been able to test sub 7.2200 meaningfully yet. The pair gapped lower at the open on constructive trade talk headlines, but for now the markets await more details.
CHINA: Central Bank Injects CNY43bn via OMO
May-12 01:23
- The PBOC issued CNY43 bn of 7-day reverse repo at 1.4% during this morning’s operations.
- Today’s maturities nil
- Net liquidity injected CNY43 bn.
- The PBOC monitors and maintains liquidity in the interbank system through the issuance of reverse repo.
- The CFETS Pledged Repo Deposit Institutions 7 Day Weighted is at 1.40%, from yesterday’s close of 1.54%.
- The China overnight interbank repo rate is at 1.46%, from the prior close of 1.45%.
- The China 7-day interbank repo rate is at 1.40%, from the prior close of 1.54%.