S&P E-Minis: Bearish Risk
Jan-27 03:10By: Taso Anastasiou
Oil Bullets+ 1
On Sep 21, we discussed the importance of the sharp sell-off in the S&P E-Minis on Oct 20. It represented a bearish break but it was too early to determine whether this was merely part of a deeper short-term correction or the start of a much stronger bearish cycle instead. Technical trend signals, taking into account price activity since Sep 20, are beginning to display bearish threats and if correct, signal the potential for a deeper retracement.
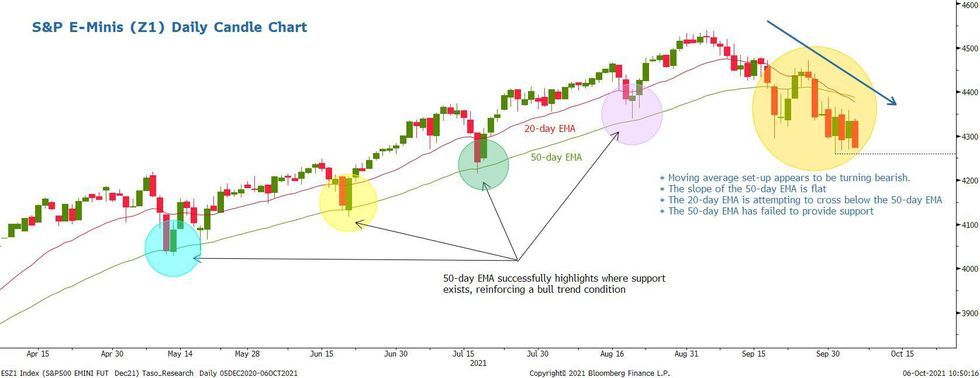
Fig 1. S&P E-Minis (Z1) and the change in the EMA set-up
The key factors to note are:
- Price remains below its 50-day EMA following a recent failed attempt to reestablish a base above this average. The EMA intersects at 4394.8 and currently represents a resistance.
- Last week saw the contract clear support at 4293.75, Sep 20 low. This is an important breach as the move lower establishes a bearish price sequence of lower lows and lower highs.
- Previously, we have highlighted the importance of the 50-day EMA as a trend support and a parameter that highlights the direction of a trend. The bearish pressure that has dominated since the contract peaked early September appears to be resulting in a directional shift in the 50-day EMA. Its slope is flat and if price remains under pressure, this will likely result in a negative sloping EMA - a negative slope highlights a bear market.
- Furthermore, the 20-day EMA appears to be crossing below the 50-day average. A confirmed cross would reinforce a bearish theme. The relationship between the 20- and 50-day EMA is also an important input when assessing the direction of a trend.
- Key levels to watch:
- Initial key resistance is the 50-day EMA, currently at 4394.80. If breached, price will need to establish a base above this EMA to undermine the developing bearish threat. This would refocus attention on; 4472.00, Sep 27 high and 4539.50, the Sep 3 high and the key bull trigger.
- On the downside, the immediate bear trigger is 4260.00, the Oct 1 low and near-term bear trigger. A break would pave the way for weakness toward 4214.50, the Jul 19 low
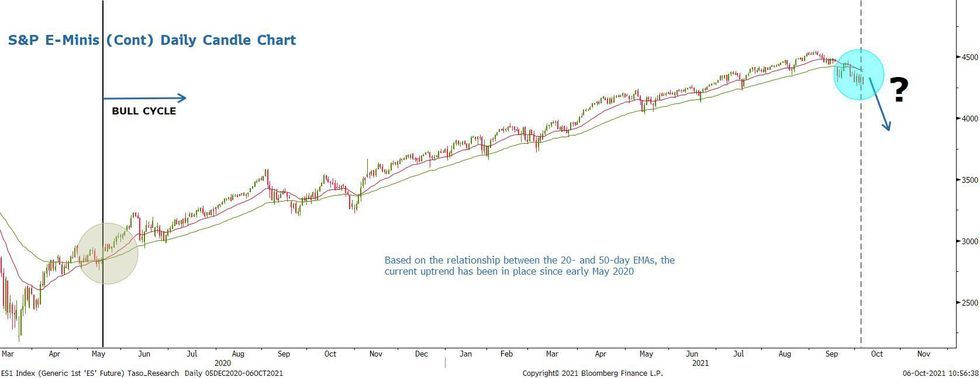
Fig 2. S&P E-Minis continuation chart highlighting the current bull cycle based on the EMA relationship