EU CONSUMER CYCLICALS: Richemont: 2Q Results (x2)
(CFRVX; NR/A+/NR) {CFR SW Equity}
Gold price spike may see more gross margin headwind ahead - which it refused to get into details on - and on which we are not too concerned with. Co runs a conservative BS by design.
- Growth was equal through the quarter. Will not comment on Q3 (will roll over a tougher +10% comp from LY).
- Tariff impact limited in 1H to €50m (50bps) due to inventory pre-loading and phasing of tariff rates (started at 10%). Expects 2H impact to be around €250m if 39% Swiss tariff rate maintained and accounts for current US inventory. Adds it does have exposure to 15% European tariffs included in that.
- Gold was 200bp headwind to gross margin. Impact will be lagged and spot has spiked +20% into end of September. It has refused to disclose gold as % of COGS in the past.
- Chairman/2nd-gen Rupert weighed in on Macro tying it to AI: "I would say, especially in the United States, the biggest visible effect that I've seen is a hollowing out of the middle class. If you look at the malls, and if you look at…they will tell you that Costco and Cartier are still doing very well…Today, if you write software that's 20% less effective, you get zero. And especially when you have an economy, an intellectual property-based economy, where you can increase production at zero marginal cost, it's a winner-takes-all economy."
Want to read more?
Find more articles and bullets on these widgets:
Historical bullets
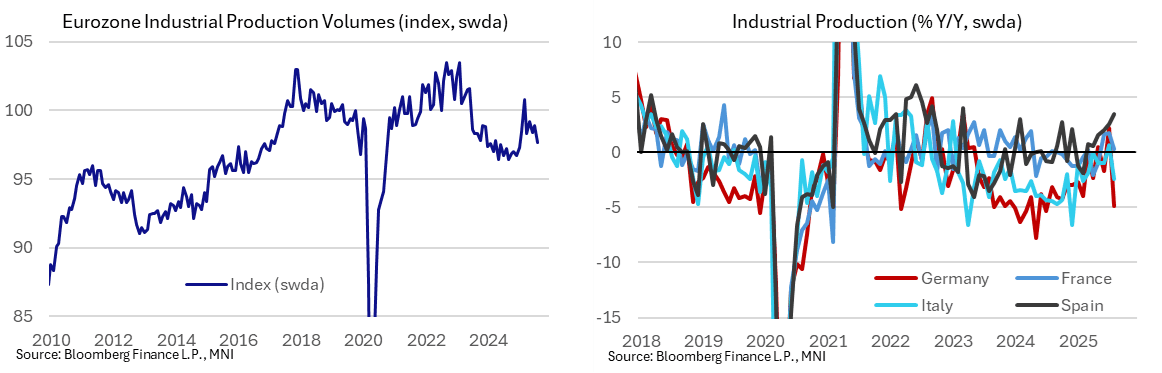
EUROZONE DATA: Ireland Boosts August IP But Weakness Broad Across Big 4, Sectors
Euro area industrial production fell -1.2% M/M in August, albeit not as weak as the -1.6% expected after all 'big 4' countries contracted. While a July revision (0.5% from 0.3% unrevised) underpins the upward surprise, Ireland had an outsized positive impact this time, at 9.8% M/M. Sequential weakness was broad-based in August with all main categories except non-durable consumer goods down M/M.
- All four main Eurozone countries saw M/M declines in August, with Germany standing out negatively at -5.2% (auto slump at least in part attributed to holiday closures and production changeovers), France at -0.7%, Italy at -2.4%, and Spain at -0.1%. These compare to July prints of 1.5%, -0.1%, 0.4% and -0.5%, respectively.
- Eurostat added an explicit comment on Ireland's 9.8% M/M print, saying "the high weight of subcontracted production makes the Irish industrial production index volatile, monthly changes can be higher than in other countries". The volatility of the series suggests a risk of reversing in September.
- August weakness was broad-based across sectors, with energy at -0.6% M/M (-1.7% prior), intermediate goods at -0.2% (0.5% prior), capital goods at -2.2% (1.7% prior), durable goods at -1.6% (1.2% prior), and only non-durable goods marginally positive at 0.1% (1.8% prior). Also on a Y/Y comparison, all sectors except non-durable consumer goods (8.2% Y/Y, not unusually high for recent months) saw declines in August.
- The Eurozone Manufacturing PMI dipped back into contraction zone amid lower factory orders in September: "September’s contraction in the headline [Manufacturing] PMI was driven by a reduction in new order inflows and a sharper rate of job shedding. Production volumes continued to expand, although the pace of growth slowed markedly from August’s near three and-a-half-year high."
OPTIONS: Larger FX Option Pipeline
- EUR/USD: Oct15 $1.1600(E1.8bln); Oct16 $1.1500-20(E1.5bln), $1.1580-00(E3.5bln); Oct17 $1.1510-15(E1.7bln), $1.1670-80(E1.0bln)
- USD/JPY: Oct15 Y143.00($1.8bln)
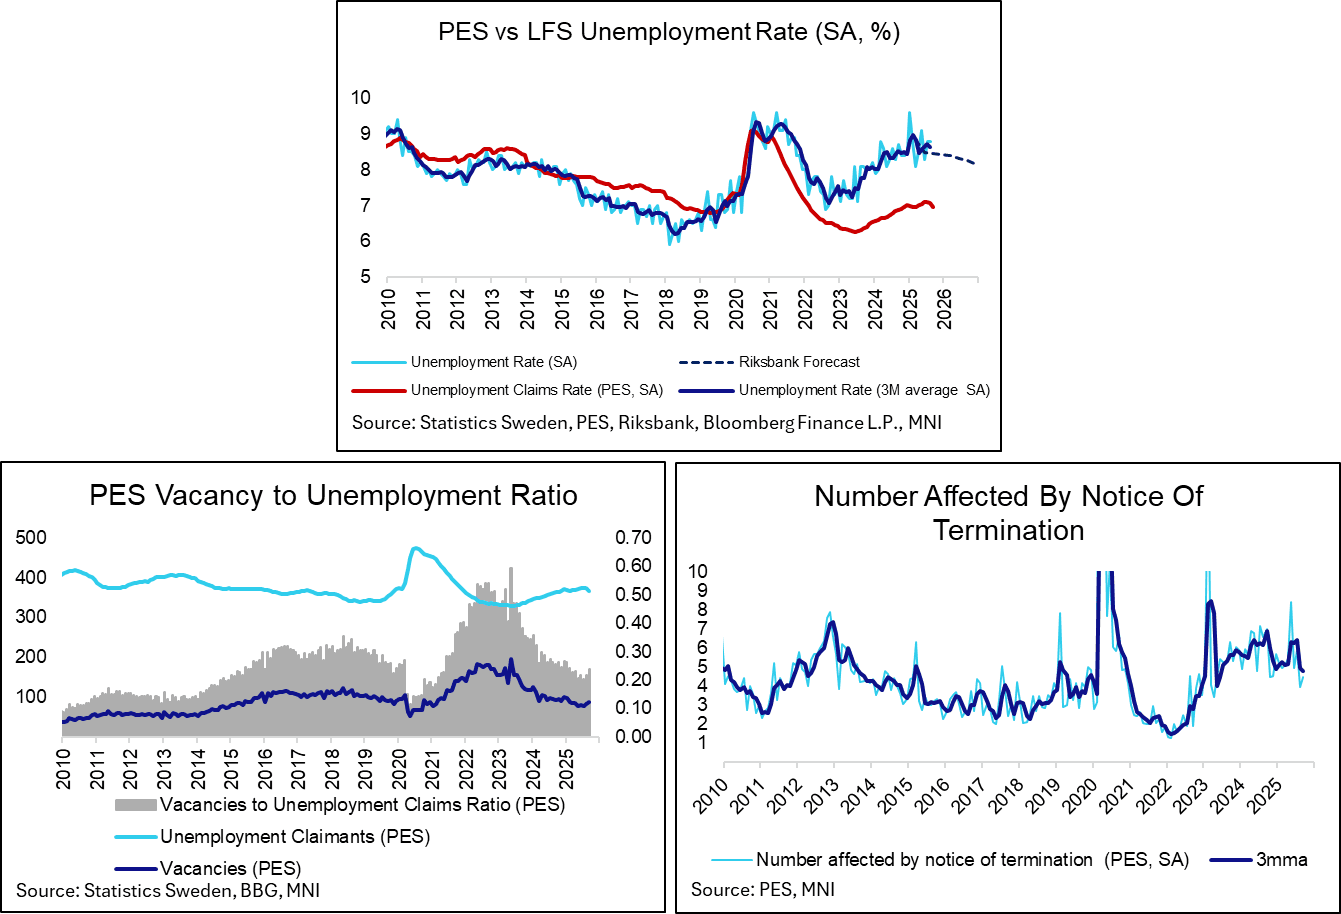
SWEDEN: Stabilising Developments In September PES Labour Market Data
Labour market data from the public employment service (PES) pointed to stabilising developments in September. The Riksbank expects labour market conditions to improve from the start of 2026, so a stabilisation in Q3/Q4 is a necessary first step. LFS unemployment data is due on Friday, with the median analyst expecting an 8.7% unemployment rate (vs 8.8% prior).
- The PES unemployment claims rate eased for the second consecutive month to 6.95% in September (vs 7.06% in August, 7.10% in June and July).
- The stock of vacancies and vacancy growth may have started to bottom out. In September, there were 87k vacancies, up from 81.5k in August for the highest since February. On an annual basis, vacancy growth remains negative a -6% Y/Y, but this is still above August’s -14% and July’s -22%.
- The 3mma of redundancy notices fell to 4,775, down from 4,922 in August for the lowest in over two years.