US DATA: Redbook Retail Sales Continue To Pull Away From "Official" Series
Notwithstanding the poor "official" December Census Bureau retail sales report released earlier Tuesday, Redbook retail sales continue to post robust gains into 2026. The Johnson Redbook retail sales index rose 6.5% Y/Y in the first week (and therefore month-to-date) of February, an acceleration from 6.3% in January though below retailers' targeted 6.9% gain for the month.
- Per the anecdotals, "Super Bowl Sunday drove increased sales of snack foods, beverages, team apparel, and related merchandise. February marks the start of spring and shifts the focus to full-price selling, with fewer clearance sales and markdowns. As the first month of the retail calendar’s first quarter, February typically sees the lowest sales volume, with early spring merchandise introductions. Sales are expected to rise later this week and next as Valentine’s Day and Presidents’ Day approach."
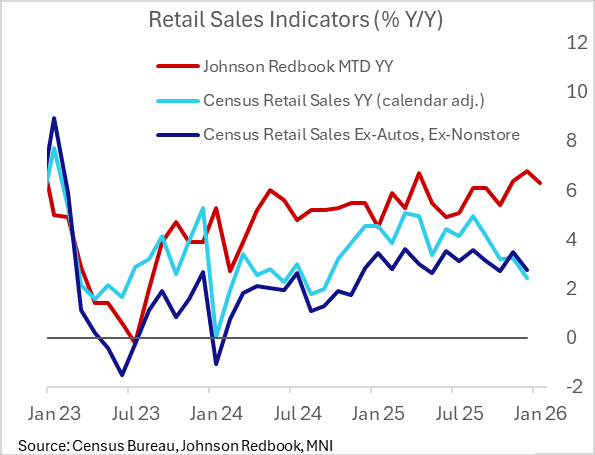
- We have to note the divergence in Q4 Census Bureau retail sales performance, which concluded 2025 with a thud on 2.4% Y/Y total / 3.4% Y/Y Control Group Sales (respectively, 15 and 16 month lows) in December, versus Redbook's 6.8% gains in December.
- In general, Census's series was notably weaker in December than other proxies of sales, including Chicago Fed's CARTS, presenting something of a puzzle.
- There has consistently been a differential in the magnitude of Y/Y gains in the Census and Redbook series, but both have generally moved in the same direction. The latest divergence is the first since summer 2024 when Redbook remained solidly above 5% but retail sales faded to close to 2%; ultimately growth resolved in Redbook's direction. There may be an issue relating to nonstore (ie e-commerce retailers) sales which have slowed badly in the Census series; excluding these and auto sales, the series look similar in direction but not in terms of the level of growth.
- A reminder of the Johnson Redbook Index's methodology: "a sales-weighted of year-over-year same-store sales growth in a sample of large US general merchandise retailers representing about 9,000 stores. Same-store sales are sales in stores continuously open for 12 months or longer. By dollar value, the Index represents over 80% of the equivalent 'official' retail sales series collected and published by the US Department of Commerce."
Want to read more?
Find more articles and bullets on these widgets:
Historical bullets
AUSSIE 3-YEAR TECHS: (H6) Recovery Mode
- RES 3: 97.796 - 1.618 proj of the Sep 3 - 12 - 15 price swing
- RES 2: 96.780 - High Jun 26 (cont)
- RES 1: 96.700 - High Sep 12
- PRICE: 95.890 @ 16:40 GMT Jan 9
- SUP 1: 95.740 - Low Dec 22
- SUP 2: 95.480 - Low 1st Nov ‘23
- SUP 3: 94.932 - 1.0% 10-dma envelope
Prices bounced again Thursday, supported by strength in global bond markets and a smoother inflation picture at the December CPI print. As such, prices edged further away from recent lows. Nonetheless, slower pricing for additional RBA easing - and partial pricing for a return to rate hikes in 2026 - should keep the front-end of the curve under pressure. This keeps prices well below prior resistance at 96.615, the Sep 12 high, and refocuses attention on 95.480 as the next major support.
MNI: MNI TEST 02, Please Ignore
Test Test TEST
MNI: MNI Test, Please Ignore
Test, ignore