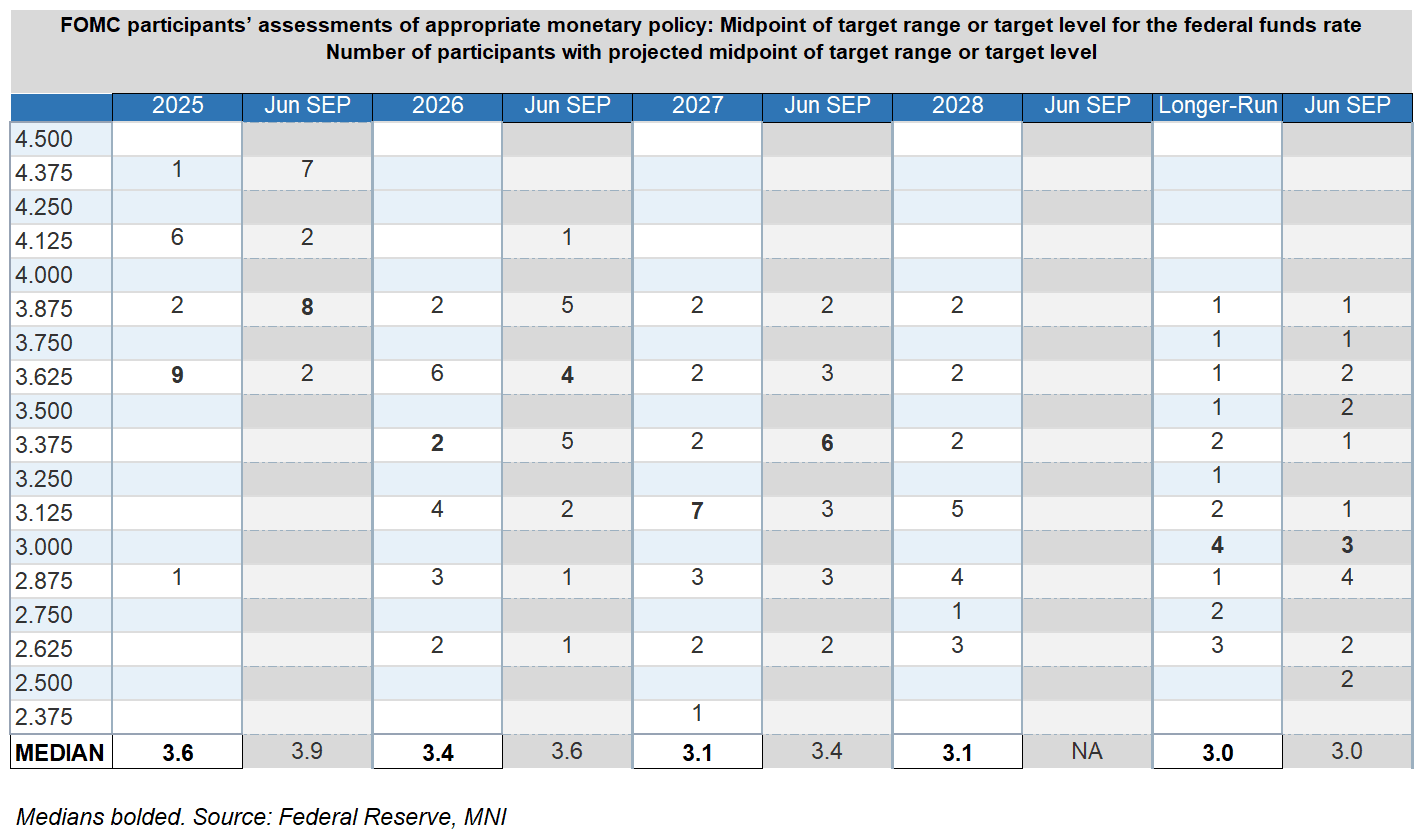
FED: Rate "Dot Plot" Comparison - September vs June
Below is a comparison of the September FOMC "dot plot" of participants' projections of end-year Fed funds rates, vs the last edition in June:
- The median shifts lower are not really a surprise (3.6% from 3.9% in 2025, 3.4% from 3.6% in 2026, then 3.1% further out and 3.0% longer-run).
- The lowest dot almost certainly belongs to the new Governor Miran who pencilled in a 2.9% dot for end-2025 and presumably sees the lowest in 2027 (2.4%) before coming back up toward neutral in 2028.
- To be sure the 2025 and to a lesser extent 2026 Dot medians were reasonably close calls though with definite shifts lower. There were 9 dots at 3.9% or above for this year and 10 at 3.6% or below, making the latter the 2025 median. We presume that includes the leadership of the Committee including Chair Powell. But interesting that one saw no cuts this year (and it wasn't a voting dissenter) and 6 see this as the last reduction. That's not much changed from the total 9 who saw zero or 1 cuts in the June Dot Plot.
- For 2026 the highest dot has shifted lower by 25bp to 3.9%, but again it's a fairly split median.8 members are at 3.6% or higher (was 10 previously), with 11 at 3.4% or below (vs 9 prior). The mean of the distribution drops lower though with 5 seeing rates at 2.9% or below, vs 2 last time. That's indicative of envisaging more back-loaded cutting.
- As for further out, the 2027-2028 medians are at roughly neutral as expected, 3.1% (2028 was newly introduced in this round of projections).
- There was an interesting shift in the longer-run dots: while the median remains 3.00%, the number above 3.4% has fallen from 6 to 4, while those at 2.50% have shifted up. There are 10 members at 3.00% or below, vs 11 last time - getting a little closer to raising the median. Some of this may be related to the changes in personnel since the June meeting (Philly's Paulson for Harker, Miran for Kugler).
Want to read more?
Find more articles and bullets on these widgets:
Historical bullets
PIPELINE: Corporate Bond Update: Eli Lilly Issues Another $6.75B Debt
Eli Lilly $6.75B 7-tranche leads today's issuance - note, however, the firm issued $6.5B on February 10 on similar tranches: $1B 3Y +27, $1.25B 5Y +42, $1B 7Y +50, $1.25B 10Y +60, $1.25B 30Y +80, $750M 40Y +90
- Date $MM Issuer (Priced *, Launch #)
- 08/18 $6.75B #Eli Lilly $1B 3Y +28, $750M 3Y SOFR+53, $750M +5Y +40, $1B 7Y +48, $1.25B 10Y +57, $1B 30Y +65, $1B 40Y +73
- 08/18 $2B #Charter Communications $1.25B 10Y +152, $750M 30Y +177
- 08/18 $1.5B #Marriott Intl $400M 2Y +47, $500M 6Y +85, $600M 10Y +105
- 08/18 $1.5B #RGA Global $800M 3Y +65, $700M 7Y +95
- 08/18 $1B #Corebridge Global $500M 3Y +58, $500M 7Y +88
- 08/18 $800M #Northwestern Mutual $500M 3Y +40, $300M 3Y SOFR+66
- 08/18 $500M #Ecolab WNG 10Y +67
- 08/18 $Benchmark McDonald's +5Y +55, +10Y +72
- Expected Tuesday:
- 08/19 $4B EIB 5Y SOFR+42a
- 08/19 $Benchmark DBJ 3Y SOFR+52
- 08/19 $Benchmark IBRD (World Bank) 10Y SOFR+62a
EURGBP TECHS: Support Remains Exposed
- RES 4: 0.8769 High Jul 28
- RES 3: 0.8744 High Aug 7
- RES 2: 0.8682 High Aug 8
- RES 1: 0.8654 20-day EMA
- PRICE: 0.8631 @ 16:39 BST Aug 18
- SUP 1: 0.8597 Low Aug 14
- SUP 2: 0.8562 50.0% retracement May 29 - Jul 28 upleg
- SUP 3: 0.8540 Low Jun 30
- SUP 4: 0.8514 61.8% retracement May 29 - Jul 28 upleg
EURGBP has breached a key support at 0.8611, the Jul 31 low and pierced the 50-day EMA, at 0.8615. A continuation lower would strengthen a bearish threat and highlight a stronger reversal of the uptrend between May 29 and Jul 28. This would open 0.8562, a Fibonacci retracement point. For bulls, a reversal higher would refocus attention on key resistance and the bull trigger at 0.8769, the Jul 28 high.
FOREX: US Dollar Edges Higher amid Trump/Zelenskyy White House Meeting
- The US dollar has traded with a constructive tone on Monday, initially assisted by softer sentiment for major equity benchmarks, and US yields turning higher across the US session then providing further support. The USD index now 0.3% higher on the session as we approach the APAC crossover. Although there has been a flurry of initial headlines from the Trump/Zelenskyy meeting at the White House, few concrete details have been provided regarding the war, with President Trump stating there is a possibility something could come out of Russia talks.
- The uptick for US yields provided a supportive backdrop for USDJPY, which briefly rose to an intra-day high of 147.99, which marks a post US PPI high for the pair. Above here, firm resistance to watch is at 148.52, the Aug 12 high, of which a breach would be viewed as a S/T bull signal.
- In similar vein, the likes of EUR and GBP have also traded with an offered tone. For EURUSD, while moves have remained shallow, spot has been consistently grinding towards last Thursday's pullback low at 1.1631, while firm support is seen at 1.1583, the 50-day EMA.
- The dollar’s focus this week will be on the Fed’s Jackson Hole Symposium, which kicks off Thursday and includes the keynote speech by Chair Powell on Friday. Attention will mostly be on any nod to a potential September cut, but a large portion of his comments will touch on the findings from the Fed's policy framework review.
- Canadian CPI is scheduled Tuesday, which will be very closely eyed given stronger-than-expected core price momentum in Q2 and an upside surprise would place the technical focus for USDCAD on both the 20- and 50-day exponential moving average supports, located around 1.3760. A clear break would resume the correction off the early August high at 1.3879, signalling scope for a move back to 1.3576, the Jul 23 low.