EUROZONE DATA: Q4 GDP Details Roughly As Expected
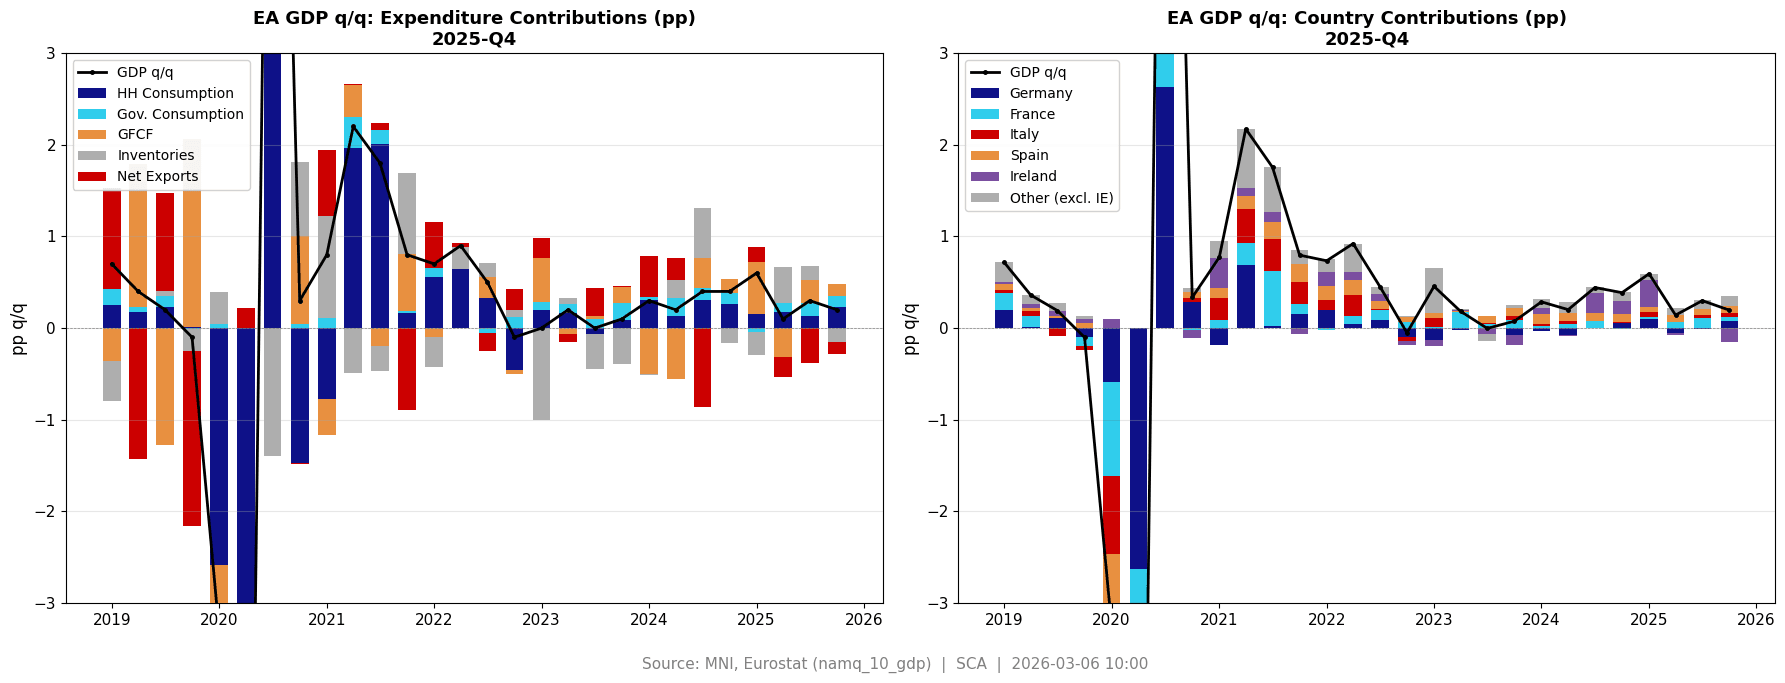
Q4 real GDP growth was revised to 0.20% Q/Q from 0.35% pre-rev (as mentioned above, this was impacted by Ireland) after 0.30% in Q3 (from 0.27% pre-rev). Final domestic demand details seem broadly in line with consensus except for weaker investment although that was offset by an upward revision to Q3:
- Consumption 0.44% Q/Q (vs 0.4% cons) after Q3 revised to 0.25% from 0.15% pre-rev
- Gross fixed capital formation 0.61% Q/Q (vs 0.8% cons) after Q3 revised to 1.25% from 1.01% pre-rev
- Government spending 0.54% Q/Q (vs 0.5% cons) after Q3 revised to 0.67% from 0.72% pre-rev
Want to read more?
Find more articles and bullets on these widgets:
Historical bullets
EURIBOR OPTIONS: More On The 98.625/99.00 Call Spread Trade
The recently covered 98.625/99.00 call spread play looks for 2.5-4.00x 25bp ECB rate cuts through September and is very low delta (3%). ERU6 trades 97.975 last, while ECB-dated OIS prices ~5bp of easing through Sep. Given the late-stage nature of the ECB’s cutting cycle (policy being deemed to be in “a good place”) and low delta of the position, we would suggest that is a hedge against an existing hawkish position in futures/elsewhere.
EURIBOR OPTIONS: Upside Structures are favoured ahead of the ECB
- ERU6 98.625/99.00cs, trades for half in 7k.
Options in the Euribor strip have picked up this Week ahead of the ECB. Some Desks are looking for a more Dovish outlook through the 2026 and targeting December.
Notable trades this Week have seen:
- ERZ6 98.00/98.06/98.12/98.18c condor, was bought for 0.25 in close to 60k.
- ERZ6 98.25/98.37cs, bought for 1.75 in 17.5k.
- ERZ6 97.93/98.00/98.06c fly, bought for 0.5 in 8.5k.
Downside trade saw:
- ERZ6 98.06/97.93/97.75p fly, bought for 4.25 in 10k.
EUROPEAN INFLATION: Eurozone HICP in line, but variation on subcomponents
- Headline 1.69% (1.7% MNI tracking and consensus, 1.97% prior)
- Core 2.19% (2.2% MNI median, 2.37% prior)
- Services 3.21% (3.3% MNI median, 3.42% prior)
- NEIG 0.36% (0.5% MNI median, 0.34% prior)
- FAT 2.74% (2.5% MNI median, 2.51% prior)
- Energy -4.06% (-4.5% MNI median, -1.94% prior)
- Note all priors using ECOICOP2 rather than the values published at the time.
Services around a tenth softer than expected (0.09ppt), NEIG 0.14ppt softer. But overall core is broadly in line - so suggests the core expectation wasn't fully consistent with services / core goods. FAT and energy are both higher than expected.
Overall this leaves headline 1.69%Y/Y - in line with the 1.7% MNI tracking and consensus.