INDONESIA: Q4 Activity Data Better But Still Soft Spots
Bank Indonesia’s decision is announced today and 29/35 analysts on Bloomberg expect rates held at 4.75% (see MNI BI Preview). However, recently it has gone against consensus. In October, it held when it was forecast to ease. With inflation firmly within its band, BI is likely to focus on broad-based rupiah weakening but also the limited pass through of 2025’s 125bp of easing to lending rates. Its three consecutive cuts in Q3 and statements that it would support government policy, which is expansionary, signalled a shift to a pro-growth stance.
- Trade and survey data since the October meeting have signalled stronger Q4 growth to date but the details show some weakness such as soft imports, wages and foreign orders.
- Q3 GDP slowed slightly to 5.0% y/y from 5.1% driven by weaker investment but was supported by a pickup in government spending. BI expects 2026 GDP to rise to 5.3% and said that it will continue to support the government’s pro-growth measures.
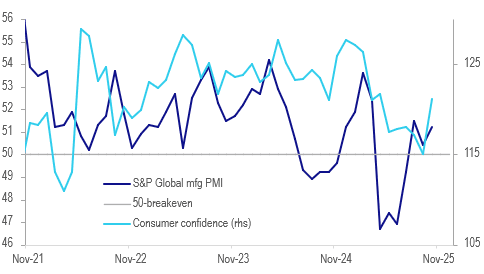
- Q3 consumption slowed marginally to 4.9% y/y from 5.0% but consumer sentiment fell 1.9% q/q. It rebounded in October to 121.2 from 115.0 despite Q3 manufacturing wages rising only 0.7% y/y after Q1’s 2.1%.
- October S&P Global manufacturing PMI rose to 51.2 after averaging 50.4 in Q3 driven by stronger domestic orders and associated increase in hiring. However, it underperformed ASEAN.
Indonesia activity outlook
Source: MNI - Market News/LSEG/Bloomberg Finance L.P.
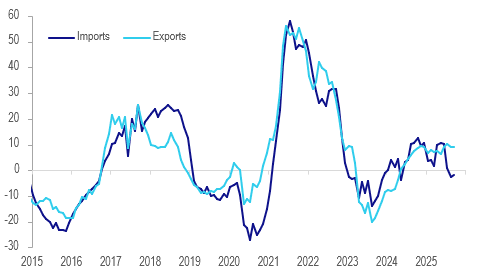
- Robust merchandise export growth at 11.4% y/y drove the September 3-month average trade surplus to its highest since December 2022. Shipments to China, US, Europe, Singapore and Thailand have been strong but weak to Japan, India and Australia.
- However, 3-month average import growth fell 1.7% y/y, a sign of soft domestic demand.
- Tourist arrivals are also slowing but still rose 9.6% y/y 3-month average in September but down from 20.7% a year ago.
Indonesia merchandise exports vs imports y/y% 3-mth moving average
Source: MNI - Market News/LSEG
Want to read more?
Find more articles and bullets on these widgets:
Historical bullets
STIR: RBNZ-Dated OIS Pricing Little Changed After Q3 CPI
While headline CPI inflation hit the top of the RBNZ’s 1-3% target band in Q3, underlying inflation remained within it but at the upper end. The RBNZ’s own measure of core from its sector factor model was stable at 2.7% y/y in Q3, remaining at the lowest since Q1 2021.
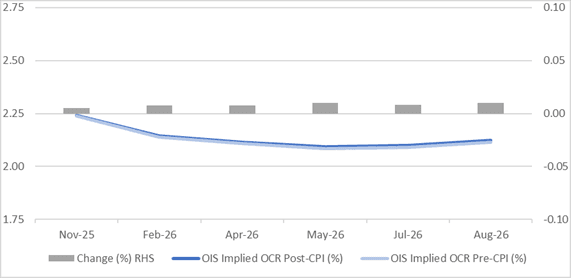
- RBNZ dated OIS pricing closed little changed across meetings. 26bps of easing is priced for November, with a cumulative 36bps by February 2026.
Figure 1: RBNZ-Dated OIS: Post-CPI vs. Pre-CPI
Source: Bloomberg Finance LP / MNI
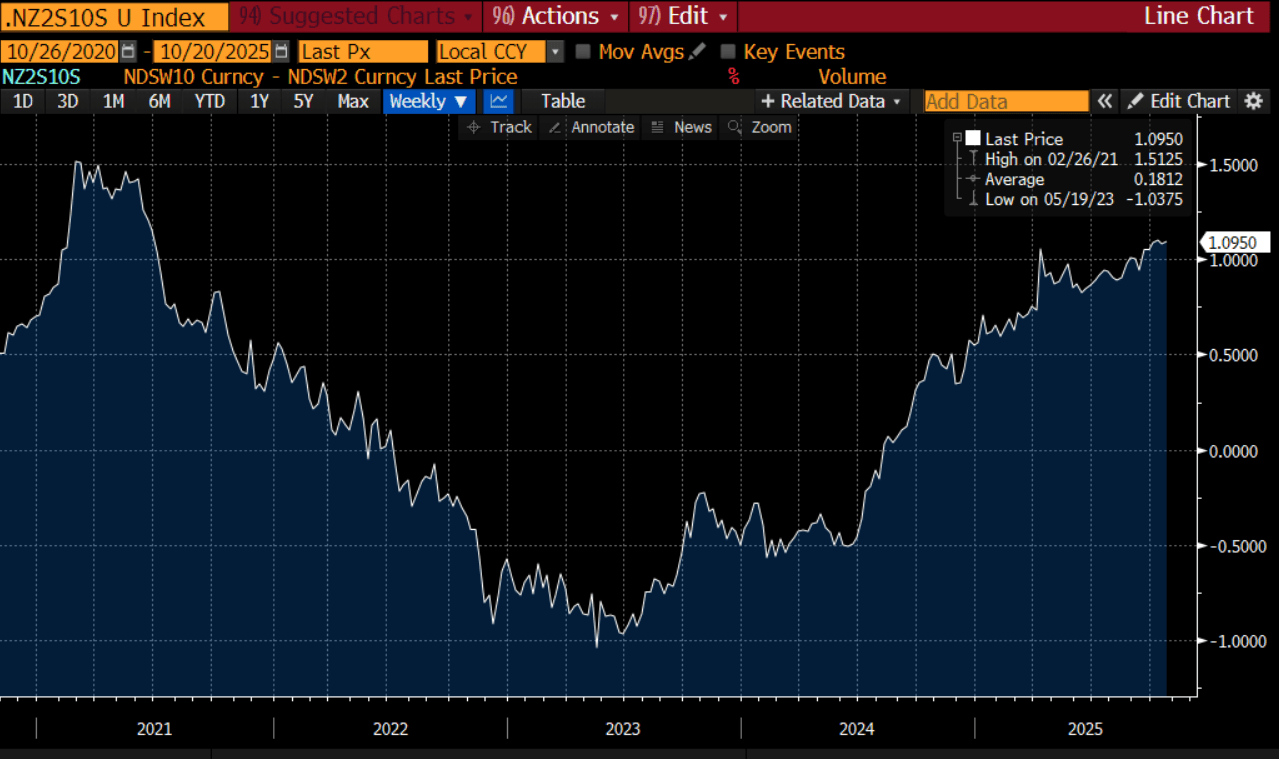
BONDS: NZGBS: Cheaper With 2s10s Swap Curve At Cycle Highs After Q3 CPI
NZGBs closed 2-4bps cheaper, with a steeper curve after today’s Q3 CPI data.
- While headline CPI inflation hit the top of the RBNZ’s 1-3% target band in Q3, underlying inflation remained within it but at the upper end. The RBNZ’s own measure of core from its sector factor model was stable at 2.7% y/y in Q3, remaining at the lowest since Q1 2021, while Statistics NZ’s CPI ex food, energy and vehicle fuel moderated 0.2pp to 2.5% y/y. While the RBNZ would like to see core inflation moderate further, it is likely to be reassured that non-tradeables moderated.
- Accordingly, Q3 CPIs are unlikely to derail any further easing at the 26 November RBNZ meeting after the 50bp this month.
- RBNZ dated OIS pricing is little changed across meetings. 26bps of easing is priced for November, with a cumulative 36bps by February 2026.
- Swap rates closed 2-4bps higher, with the 2s10s curve around cycle highs. (see chart)
- Tomorrow, the local calendar will see Trade Balance data
- On Thursday, the NZ Treasury plans to sell NZ$225mn of the 4.50% May-30 bond, NZ$175mn of the 4.25% May-36 bond and NZ$50mn of the 5.00% May-54 bond.
Bloomberg Finance LP
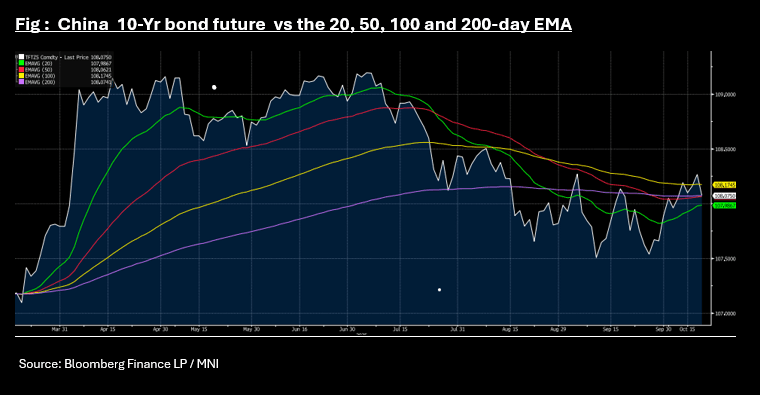
CHINA: Bond Futures Sell off as CGB 10-Yr Range Holds
- China's bond futures are all lower in Monday trade as this morning's OMO withdrew liquidity for a third successive day and equities rally.
- The 10-Yr is down -0.19 for its worst one day fall in a month down breaking below the 100-day EMA of 108.17 and near to the 200-day EMA of 108.07 and the 50-day EMA of 108.06.
- The 2-Yr is down -0.04 at 102.336 trending below the 20-day EMA of 102.36 having traded above it only briefly.
- The bond market has for best part of this year seen the 10-Yr trading in a +18bps range, with no signs of a breakout. The move above 1.90% in the CGB 10-Yr at the beginning of the month was short lived with it moderating back to 1.82% at the bottom end of recent ranges on Friday, and has edged up to 1.84% this morning.
- Having had a period of relative consistent liquidity injections via the daily OMO, last week saw two significant withdraws late in the week and a more modest withdrawal today, which may be contributing to the downward move in yields and could be indicative of things to come.
- Central Government bond issuance this week is focused on the 3-10 Year maturities, with significant size to be issued.
- China to Sell CNY127 Bn 2028 Bonds
- China to Sell CNY149 Bn 2035 Bonds
- China to Sell CNY55 Bn 91-Day Bills
- China to Sell CNY55 Bn 182-Day Bills
- China to Sell CNY118 Bn 2032 Bonds
- China to Sell CNy129 Bn 2030 Bonds