PERU: Prosecutors Request Travel Ban Against Former President Boluarte
Oct-10 16:19
- The Canal N TV news channel in Peru has reported that prosecutors have requested a 36-month travel ban against former President Boluarte to prevent her from leaving the country while investigations against her continue. As a reminder, Boluarte was removed from office by Congress in a sudden impeachment vote last night.
- "The Public Prosecutor's Office has requested that the Judiciary ban former President Dina Boluarte from leaving the country for 36 months , as part of the ongoing investigation into alleged money laundering."
- "The measure seeks to ensure the former president's presence during the criminal proceedings and prevent a possible flight from the country." (Canal N, translated)
Want to read more?
Find more articles and bullets on these widgets:
Historical bullets
LOOK AHEAD: Thursday Data Calendar: August CPI, Weekly Claims, 30Y Sale Re-Open
Sep-10 16:10
- US Data/Speaker Calendar (prior, estimate)
- 09/11 0830 CPI MoM (0.2%, 0.3%). YoY (2.7%, 2.9%)
- 09/11 0830 CPI Ex Food and Energy MoM (0.3%, 0.3%). YoY (3.1%, 3.1%)
- 09/11 0830 CPI Index NSA (323.048, 323.921), Core Index SA (328.656, 329.640)
- 09/11 0830 Real Avg Hourly Earning YoY (1.2%, --), Weekly Earnings YoY (1.1% rev, --)
- 09/11 0830 Initial Jobless Claims (237k, 235k), Continuing Claims (1.940M, 1.950M)
- 09/11 1130 US Tsy $100B 4W & $85B 8W bill auctions
- 09/11 1200 Household Change in Net Worth (-$1.595T, --)
- 09/11 1300 US Tsy $22B 30Y Bond auction re-open (912810UM8)
- 09/11 1400 Federal Budget Balance (-$380.1B, -$324.5B)
- Source: Bloomberg Finance L.P. / MNI
US DATA: Looking Past Trade Margin Volatility, PPI Trends Remain Moderate (2/2)
Sep-10 16:06
Looking even closer into the 0.2% M/M final demand services drop in August's PPI report, three-quarters (per the BLS) of the decrease was due to a 3.9% M/M fall in margins for machinery and vehicle wholesaling, after a 1.6% increase in July. That 1.6% was revised down from a very high 6.7% in the initial reading.
- With multiple other categories of trade services seeing margins decrease, most after rises in July (professional and commercial equipment wholesaling, along with retailers in the furniture, food and alcohol among others), the 1.7% drop in overall trade services margins (after July had been revised down to 1.0% growth from 2.0%) brings it back to January levels.
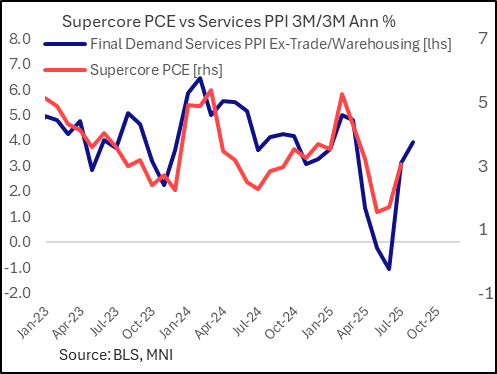
- That being said, we don't take much signal from the trade services categories, being that they don't feed into the Fed's preferred core PCE gauge and have too many methodological issues to interpret on a month-to-month basis. (Re PCE, the PPI data suggests that supercore PCE will moderate in Aug vs Jul on a M/M basis, even if 3M/3M annualized momentum continued to pick up a little largely on account of the strong July readings - see chart).
- Recall that July's jump caused great speculation over whether retailers/wholesalers were somehow increasing gross margins in anticipation of higher input prices due to tariffs, or that the margins were overstated as reported paid prices hadn't fed completely through and/or existing inventories were being sold down instead of new product. We may never have a conclusive answer to this, at least from the PPI data, and we certainly wouldn't draw any conclusions for the month's CPI goods data.
- When we step back and take a broader perspective on producer price inflation, we see some upside pressures in spots but not what would - yet - represent major new concerns over tariffs' impact on consumer prices.
- To be sure, there are some potential pressures emerging - nondurable consumer goods ex-food/energy rose to 0.5% M/M from 0.2%, with finished durable consumer goods inflation remaining steady at a reasonably elevated 0.3% for a 3rd month. This meant overall finished consumer goods ex-food/energy rose 0.4% M/M on a seasonally-adjusted basis, around the perkiest levels seen in the last three years, but this tends to move around month-to-month.
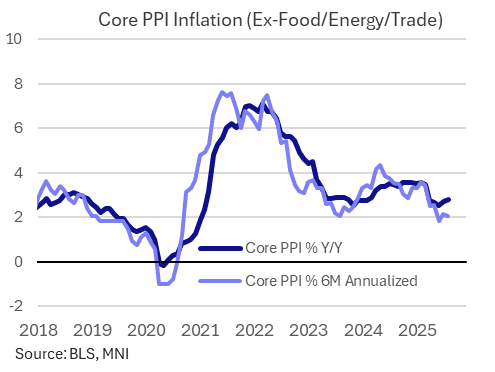
- It can be said that overall PPI is probably running a little hotter than may be compatible with the Fed's 2% target, but that's not a new development, and indeed trend rates both Y/Y and 6M annualized for core are running slower vs 2024 levels and close to pre-pandemic levels.
- On a year-on-year basis, final demand PPI ex-trade/transportation/warehousing (ie margin-imputed, volatile categories) are at fairly "normal" levels of 2.8% Y/Y, around the same the last few months and down from above 3.5% at the start of the year. On a 6-month annualized basis, core PPI has been running at about 2% in recent months.
- There has been a very slow but perceptible drift higher in final demand goods (total and ex-food/energy) PPI since early 2024, but even so - at 2-3%, it's nothing close to the 2021-22 levels (8-10%) that augured soaring goods inflation, and not even yet reaching 2017-2018 levels (3%).
OPTIONS: Larger FX Option Pipeline
Sep-10 16:04
- EUR/USD: Sep12 $1.1550(E1.7bln), $1.1600(E1.1bln), $1.1650(E1.4bln), $1.1670-75(E1.6bln), $1.1700(E2.5bln), $1.1724-35(E1.5bln) $1.1800(E1.5bln), $1.1850(E1.4bln); Sep15 $1.1690-00(E1.0bln); Sep16 $1.1700-15(E1.1bln), $1.1750(E1.1bln), $1.1800(E1.5bln)
- USD/JPY: Sep12 Y146.00($1.1bln), Y147.40-50($2.4bln), Y151.00($1.1bln); Sep15 Y150.00($1.0bln); Sep16 Y145.85-00($2.1bln), Y150.00($1.5bln)