US DATA: Private Labor Indicators To Watch Over The Next Two Days
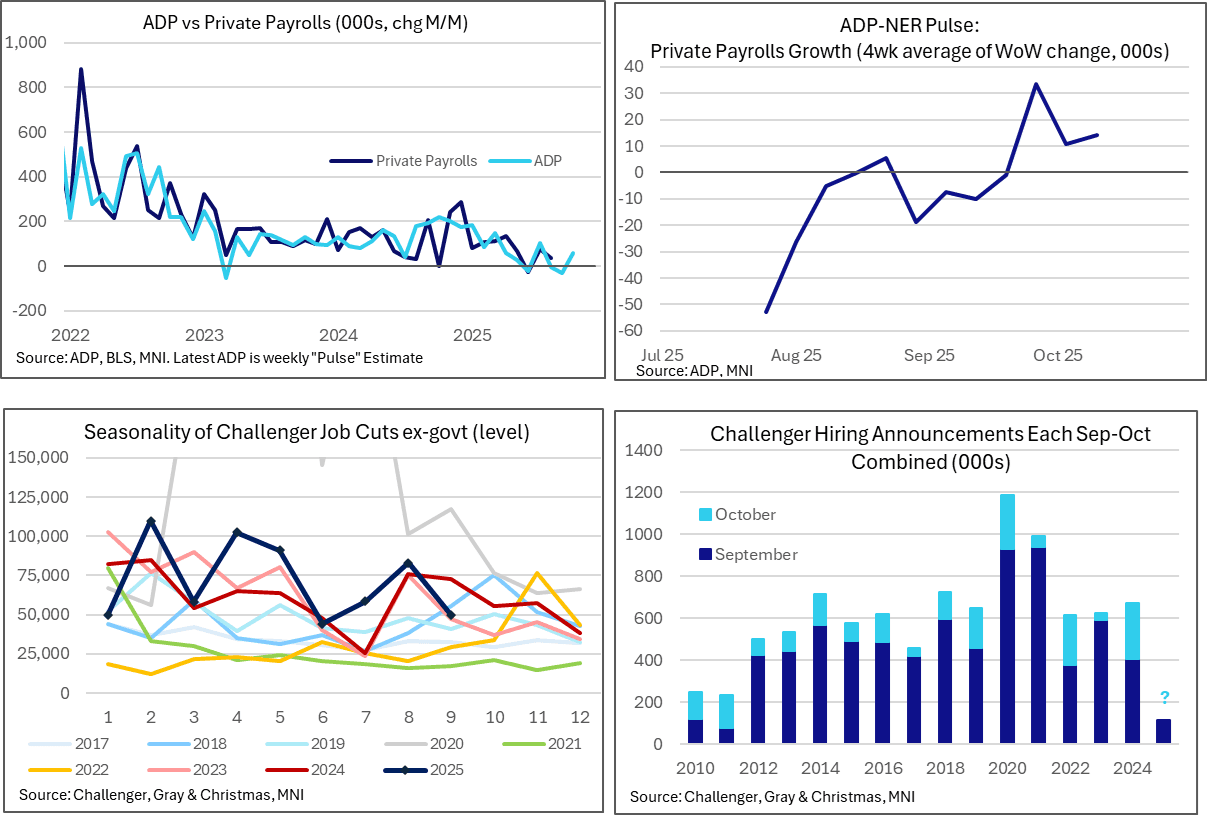
The next two days see some private sector labor indicators that likely will see particular attention this week with a lack of BLS releases. ADP is expected to see some stabilization after recent job losses, with added questions over how its regular monthly report correlates with a newly published weekly series, whilst the Challenger report offers a look at hiring plans for a second important seasonal month.
- The ADP employment report on Wednesday is expected to point to a 40k increase in private payrolls in October after a surprisingly weak -32k in September and -3k in August.
- Surprisingly released last week, the ADP weekly “Pulse” report pointed to private payrolls growth of 57k over the course of the four weeks ending Oct 11, reported as an average weekly increase of 14.25k.
- There are question marks as to how this weekly series correlates with the longer standing monthly report but with clearly some expectation that the labor market stabilized in October vs prior ADP-implied additional weakness.
- The Challenger report on Thursday meanwhile will be watched not only for its usual summary of layoffs in October but also the second useful month for hiring plans, being highly sensitive to seasonal hiring typically announced in September and October.
- Layoffs encouragingly fell 26% Y/Y in last month’s report for September, the largest decline since January, albeit flattered by an unusually high Sep 2024.
- Hiring plans were extremely low however in a key month of September, at just 117k vs 404k last year, and should be watched for October. There should be a 250k contribution from Amazon in October, although that was also the case in Oct 2024, i.e. the timing of Amazon plans wasn’t behind last month’s weak reading. Rather, anecdotal evidence points to broader hiring lethargy, with Target for instance in 2024 announcing 100k of seasonal workers (as has been the case since 2021) but this year it has in part instead offered additional hours to its current employees.
Want to read more?
Find more articles and bullets on these widgets:
Historical bullets
USDCAD TECHS: Fresh Cycle High
- RES 4: 1.4111 High Apr 10
- RES 3: 1.4045 3.0% Upper Bollinger Band
- RES 2: 1.4019 38.2% retracement of the Feb 3 - Jun 16 bear leg
- RES 1: 1.3989 200-dma
- PRICE: 1.3953 @ 16:02 BST Oct 3
- SUP 1: 1.3897/3825 Low Sep 30 / 50-day EMA
- SUP 2: 1.3727 Low Aug 29 and a bear trigger
- SUP 3: 1.3689 Low Jul 28
- SUP 4: 1.3637 Low Jul 25
A bull cycle in USDCAD remains intact and yesterday’s break above the late September’s high, firms the bullish theme. This move higher also maintains the bullish price sequence of higher highs and higher lows. Note too that moving average studies are in a bull-mode position, highlighting a dominant uptrend. Sights are on 1.4019, a Fibonacci retracement point. On the downside, first key support lies at 1.3825, the 50-day EMA.
AUDUSD TECHS: Support Remains Intact For Now
- RES 4: 0.6763 1.382 proj of the Jun 23 - Jul 24 - Aug 21 price swing
- RES 3: 0.6726 1.236 proj of the Jun 23 - Jul 24 - Aug 21 price swing
- RES 2: 0.6660/6707 High Sep 18 / 17 and key resistance
- RES 1: 0.6629 High Sep 30 & Oct 01
- PRICE: 0.6603 @ 16:01 BST Oct 3
- SUP 1: 0.6527/21 61.8% of the Aug 21 - Sep 17 bull leg / Low Sep 26
- SUP 2: 0.6484 76.4% retracement of the Aug 21 - Sep 17 bull leg
- SUP 3: 0.6463/6415 Low Aug 27 / Low Aug 21 / 22 and a bear trigger
- SUP 4: 0.6373 Low Jun 23
The AUDUSD uptrend remains intact and recent weakness appears to have been a correction. Support to watch lies at the 50-day EMA, at 0.6558. A clear break of this average would signal scope for a deeper retracement and expose 0.6527 once again, a Fibonacci retracement. For bulls, a stronger reversal higher would refocus attention on 0.6707, the Sep 17 high. Initial resistance to watch is 0.6629, the Sep 30 and Oct 1 high.
US TSYS/SUPPLY: September's Coupon Auctions Were Generally Solid (2/2)
September’s coupon auctions were generally solid, with three lines trading through, two coming out on the screws and two tailing slightly.
- Looking through the lens of MNI’s Relative Strength Indicator (RSI), five lines saw positive readings while two saw negative readings.
- The 3-year sale was the strongest auction of the month according to MNI’s RSI. The 3-year line traded through 0.7bps, the largest stop through in seven months. Meanwhile, the primary dealer take-up was just 8.4%, the lowest on record (data going back to 2003).
- The weakest sale of the month was the last – the 7-year line. This line saw the second consecutive 0.5bp tail, with the 12.0% primary dealer take-up above August’s 9.8% and July’s record low 4.1%.
September Auction Review:
- 2Y Note on-the-screws: 3.571% vs. 3.571% WI.
- 2Y FRN: 0.200% high margin vs. 0.195% prior
- 3Y Note trade-through: 3.485% vs. 3.492% WI.
- 5Y Note tail: 3.710% vs 3.709% WI.
- 7Y Note tail: 3.953% vs. 3.948% WI.
- 10Y Note trade-through: 4.033% vs. 4.047% WI.
- 10Y TIPS: 1.734% high yield vs. 1.985% prior
- 20Y Bond trade-through: 4.613% vs 4.615% WI.
- 30Y Bond on-the-screws: 4.651% vs. 4.651% WI.
