UK DATA: Pre-Budget Caution, Wet Weather Drive Seventh Straight Footfall Decline
UK footfall decreased 0.8% Y/Y in November, after -0.7% in October, per the BRC's footfall monitor. This marks the seventh consecutive year-on-year decline, with the BRC highlighting wetter weather and pre-Budget caution causing consumers to hold off purchases in November. However, this may have been at least partly offset if it drove up online purchases (which would impact headline retail sales measures), and it may be that the Budget delayed some Christmas shopping into December.
- "Wet weather and the prospect of a tax-rising Budget meant some shoppers held off shopping visits last month", notes the BRC. "Storm Claudia prompted many consumers to search online for Black Friday deals throughout November, leading some to not visit bricks-and-mortar stores on Black Friday."
- This release covers 2-29 November, the same four weeks as the upcoming BRC retail sales (9 Dec) and the ONS's retail sales data (19 Dec). It therefore includes Black Friday and the following Saturday but the Sunday and Cyber Monday will be covered by December data.
- Note that last year the reporting period ended on Saturday 23 November (almost an entire week ahead of Black Friday). And so despite half of the Black Friday "weekend" being within the reporting period this year, footfall was still lower than last year.
- We are always cautious about placing too much weighting on footfall data as the proportion of online purchases can vary (particularly around sales events).
- We would also warn against reading too much into the data given that footfall is heavily influenced by when consumers choose to do their Christmas shopping. December data would help put this release into context and show full impact of Budget uncertainty and Black Friday deals.
- It may be that when the Budget confirmed there was not an imminent income tax hike, consumers felt a little more comfortable spending.
- Still, despite all of these caveats, it is hard not to be concerned about the state of the consumer with this data release.
- Footfall fell in all three major location categories: shopping centre footfall fell 1.3% Y/Y (vs -0.9 Oct) high street footfall -1.2% Y/Y (vs +0.6% Oct), and retail park footfall -0.4% (vs -0.5% Oct)
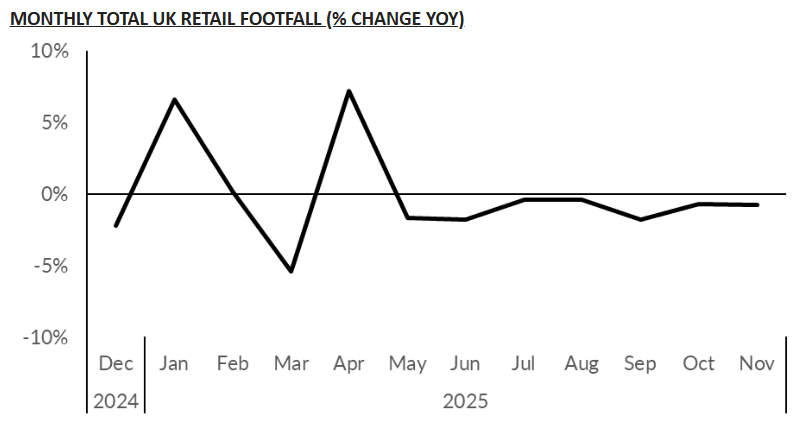
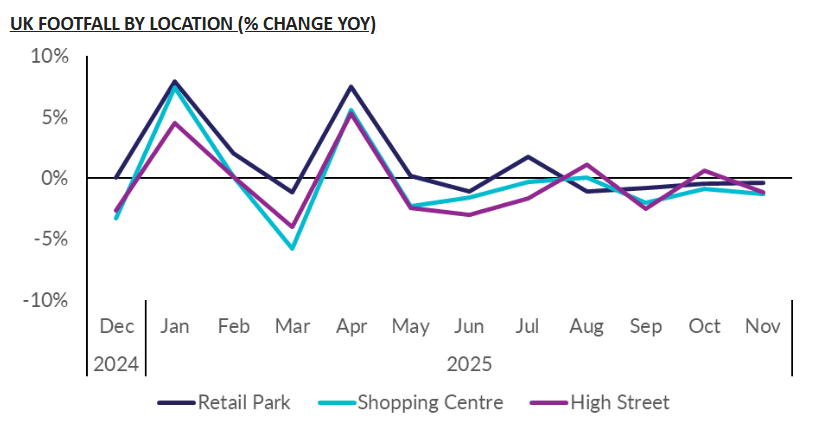
Chart source: BRC-Sensormatic Footfall Monitor
Want to read more?
Find more articles and bullets on these widgets:
Historical bullets
AUDNZD: AUD/NZD - Probes The 1.1500 Area On Poor NZ Unemployment Data
The overnight range was 1.1452 - 1.1513, the Cross is dealing in Asia around 1.1495. The Cross initially looked to have stalled ahead of 1.1500 as the market was hoping for a more hawkish RBA, but some more poor NZ employment data this morning has given it the nudge it needed to have a peek above 1.1500. This 1.1500 area remains tough resistance and I will be watching the price action to see if the market can build any momentum above here. Above 1.15/16 and the market will start to get bulled up as the focus will turn toward the 1.2000 area and beyond.
- MNI BRIEF: New Zealand Unemployment 5.3% In Q3. The underutilisation rate edged up to 12.9% from 12.8%, while the employment rate eased to 66.6% from 66.8%. The Reserve Bank of New Zealand expects unemployment to reach 5.2% by December.
Fig 1: AUD/NZD spot Weekly Chart
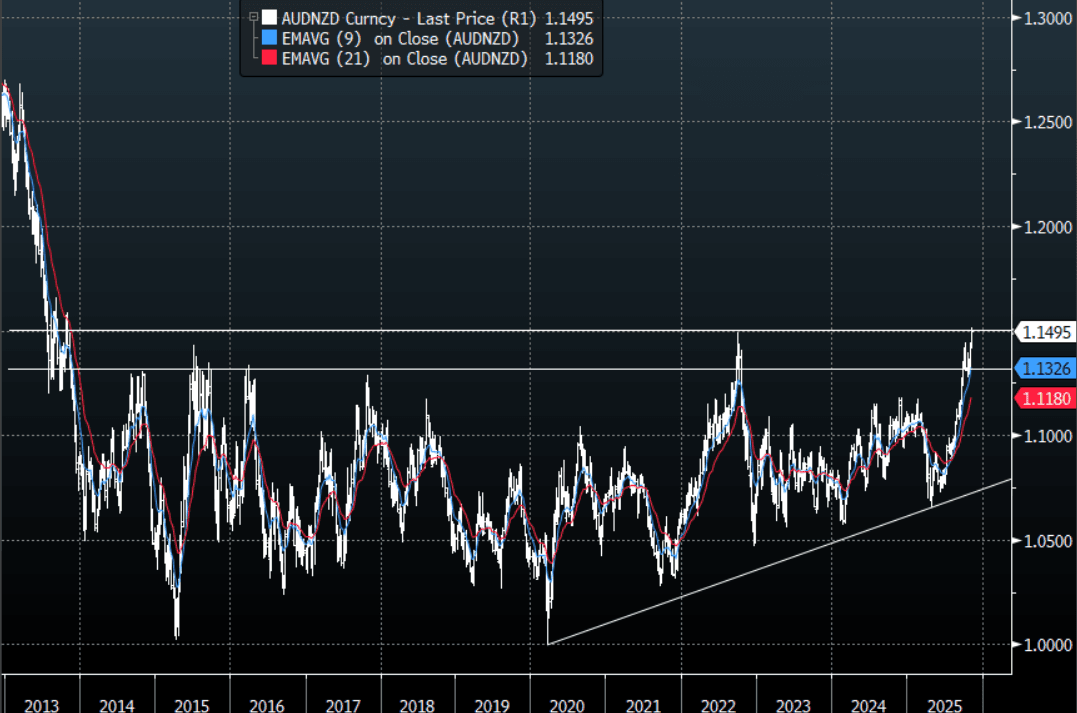
Source: MNI - Market News/Bloomberg Finance L.P
JGB TECHS: (Z5) Tilts Higher
- RES 3: 140.08 High Jun 13
- RES 2: 139.05 High Aug 4
- RES 1: 137.30 - High Sep 8 and key short-term resistance
- PRICE: 135.94 @ 16:11 GMT Nov 4
- SUP 1: 135.61 - Low Oct 08
- SUP 2: 135.39 - 1.618 proj of the Aug 4 - Sep 2 - Sep 8 swing (cont.)
- SUP 3: 134.69 - 2.000 proj of the Aug 4 - Sep 2 - Sep 8 swing (cont.)
Prices started last week well, growing the gap with next support into the 135.61 Oct 08 low. Despite this stability, prices remain inside the firm downtrend that’s dominated prices since mid-September, and prices will need to challenge resistance before signaling any broader reversal. Key short-term resistance has been defined at 137.30, the Sep 8 high. Further weakness would open 135.39 next, a Fibonacci projection.
US STOCKS: Russell Index - Ugly Price Action Threatens A Move Back Below 2400
The Russell 2000 overnight range was 2427.34 - 2457.12, closing -1.78%. The Russell 2000 took another leg lower yesterday as the risk backdrop turned negative. The price action above 2500 does not look great and should the unwind in risk start to gain momentum small caps could come under some serious pressure. The bulls will be looking for dips to be supported and hoping the 2400 area continues to hold. The risk is a break sub 2400 which would indicate the move higher was a false break and could signal a deeper pullback. Should this level break the first target would be toward the 2250-2300 area.
- Lance Roberts wrote on X that “Wall Street continues to expect a massive improvement in earnings for small cap companies after several years of weak growth. Notably, that weak earnings growth occurred during a strong economic environment. Given that the forward outlook for the economy is weakening, those expectations may be disappointed.”
Fig 1: Russell 2000 Weekly Chart
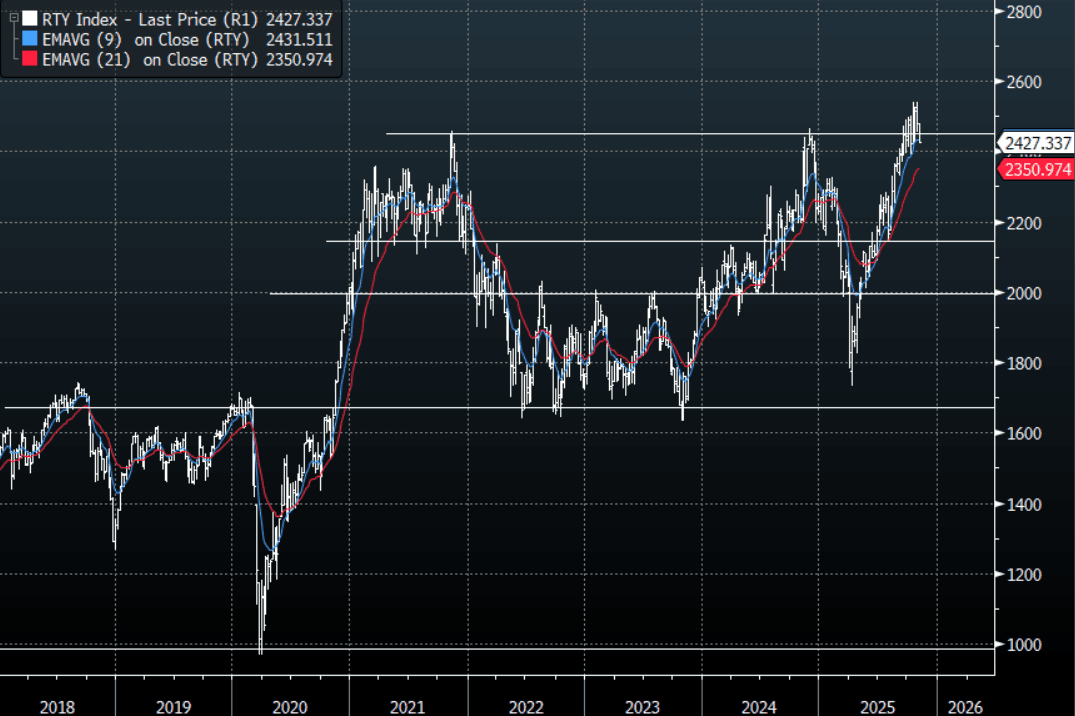
Source: MNI - Market News/Bloomberg Finance L.P