POWER: German Afternoon Renewable Forecast
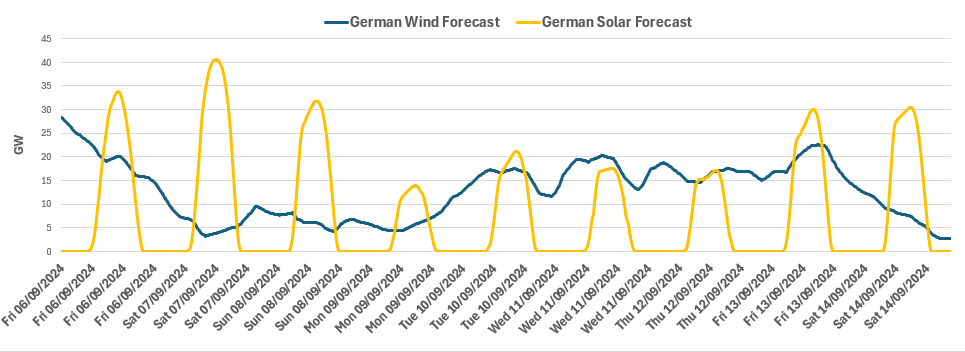
See the latest German renewables forecast for base-load hours for the next seven days from this afternoon, including the midday change. German wind was revised sharply up on 10 September from midday – likely dropping prices on the day, with wind only slightly higher than France – likely narrowing the FR-DE spread from the previous session.
German: Wind for 6-13 September:
- 6 September: 20.24GW (-219MW),
- 7 September: 6.49GW (-188MW),
- 8 September: 6.67GW (-565MW),
- 9 September: 6.37GW (unchanged),
- 10 September: 15.09GW (+1.91GW),
- 11 September: 17.33GW (unchanged),
- 12 September: 16.67GW (unchanged)
- 13 September: 18.43GW
German: Solar for 6-13 September:
- 6 September: 10.32GW (unchanged),
- 7 September: 13.05GW (+209MW),
- 8 September: 10.09GW (-226MW),
- 9 September: 4.25GW (unchanged),
- 10 September: 6.64GW (+119MW),
- 11 September: 5.65GW (-251MW),
- 12 September: 5.61GW (-235MW)
13 September: 9.43GW
Want to read more?
Find more articles and bullets on these widgets:
Historical bullets
EQUITY TECHS: Cont: Correction Or Reversal In Nasdaq 100?
NASDAQ 100 Index (NDX)
- The MA structure is very similar in the Nasdaq index.
- MA studies are in a bull-mode set-up, however, the Aug 5 sell-off has resulted in a break of the 200-day EMA. A clear break is still required and price will need to remain below EMA and extend lower to highlight a more important medium-term reversal threat.
- The 200-day EMA currently lies at 17919.38. A key support has also been defined at 16973.94, the Apr 19 low. The area between these two price points represents a key support zone.
Short-Term Considerations
- Both Indices are oversold and a recovery would allow this condition to unwind.
- Key resistance is seen at:
- SPX: 5425.40 - the 50-day EMA
- NDX: 19298.07 - the 50-day EMA
- The 50-day EMA is an important resistance where a break would highlight a bullish development and a potential resumption of the primary uptrend.
EQUITY TECHS: Correction Or Reversal In The S&P 500?
A steep and impulsive bear cycle has dominated price action in the equity space. This has confirmed a bearish short-term trend condition. A look at longer-term charts highlight some important technical considerations.
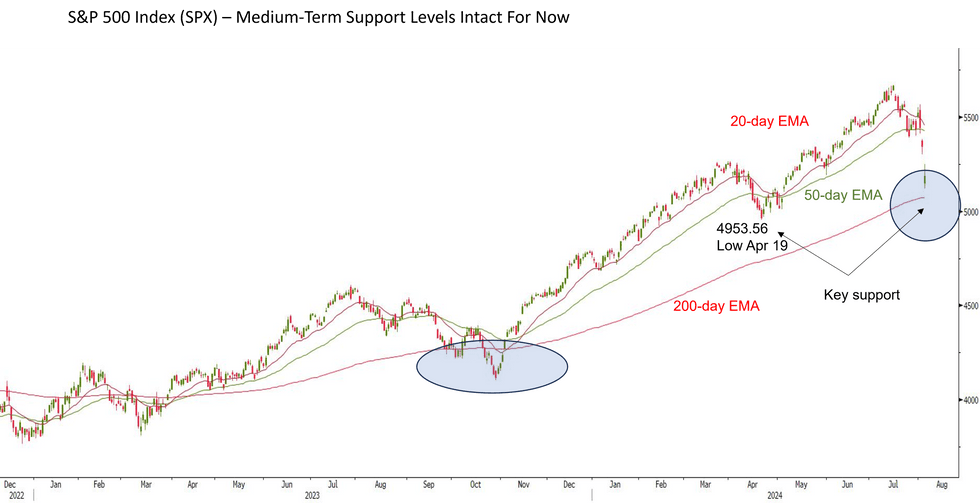
S&P 500 Index (SPX)
- Looking at MA studies, the medium and long-term trend remains up. In the chart attached, the 200-day EMA - a long-term trend identifier - maintains a positive slope and for now at least, price continues to trade above this average.
- Furthermore, the 20- and 50-day EMAs are in a bull-mode set-up - 20 day EMA above the 50-day EMA. This relationship highlights the medium-term trend structure.
- The chart also highlights an important support - the Apr 19 low of 4953.56.
- A clear break of the 200-day EMA and support at 4956.56, would be regarded as an important bearish development.
- The last time price tested support at the 200-day EMA, was Oct-Nov 2023. This example illustrates an additional key technical feature - if price is unable to remain below the EMA once breached, a false break is likely to lead to a resumption of the uptrend.
- While support holds, there is a strong likelihood that the recent steep drop in price is part of a fast correction.
GILT AUCTION PREVIEW: On offer next week
The DMO has announced that it will sell GBP3bln of the 3.75% Jan-38 Gilt (ISIN: GB00BQC4R999) at its auction next Tuesday (13 Aug).