OPTIONS: Larger FX Option Pipeline
Aug-16 16:22
- EUR/USD: Aug20 $1.0900-15(E1.7bln), $1.0925(E1.7bln), $1.0995-00(E1.4bln), $1.1090-00(E1.1bln); Aug21 $1.0890-05(E1.9bln); Aug22 $1.0905-20(E1.8bln)
- USD/JPY: Aug20 Y148.00($1.2bln); Aug22 Y148.00($1.1bln), Y148.65($1.5bln)
- EUR/JPY: Aug22 Y159.95(E1.2bln)
- AUD/USD: Aug22 $0.6630-50(A$2.6bln)
- NZD/USD: Aug22 $0.5940-55(N$1.3bln)
Want to read more?
Find more articles and bullets on these widgets:
Historical bullets
CANADA DATA: Widest Income Inequality Since 2008
Jul-17 16:15
Today’s Q1 release for the distribution household economic accounts showed even greater income inequality, primarily on account of investment gains, in what is otherwise quite a mixed release.
- Income inequality widened further, with the gap in the share of disposable income between the top 40% and bottom 40% at its widest since 2008 (higher yields on saving & invt accounts vs borrowing costs).
- There are some mixed results even within that. Households in the bottom 20% of the income distribution saw above-average Y/Y gains in disposable income in Q1 yet the middle 60% lagged as wage gains did not keep pace with higher interest payments.
- Youngest households (<35yrs) were the only age group to continually decrease their mortgage debt balances since end-2022 on affordability concerns. As such, the debt-to-income ratio for younger age groups declined for the first time in three years.
- However, the 35-44yr old cohort has the highest debt-to-income ratio of any age group (264% GDP in Q1, but still -4pps a year earlier) and saw a new record high in the interest-only debt service ratio of 12.4% of disposable income.
 Change in average household mortgage debt by age group of major income earnerSource: Statistics Canada
LOOK AHEAD: Thursday Data Calendar: Weekly Claims, 10Y TIPS Sale, TIC Flows
Jul-17 16:14
- US Data/Speaker Calendar (prior, estimate)
- Jul-18 0830 Initial Jobless Claims (222k, 229k)
- Jul-18 0830 Continuing Claims (1.852M, 1.856M)
- Jul-18 0830 Philadelphia Fed Business Outlook (1.3, 2.9)
- Jul-18 1000 Leading Index (-0.5%, -0.3%)
- Jul-18 1130 US Tsy $90B 4W, $85B 8W bill auctions
- Jul-18 1300 US Tsy $19B 10Y TIPS auction
- Jul-18 1345 Dallas Fed Logan, open remarks Dallas Fed conf (text, no Q&A)
- Jul-18 1600 Total Net TIC Flows ($66.2B, --)
- Jul-18 1600 Net Long-term TIC Flows ($123.1B, --)
- Jul-18 1800 Dallas Fed Daly fireside chat (no text, Q&A)
- July-18 1945 Fed Gov Bowman keynote address (text, no Q&A)
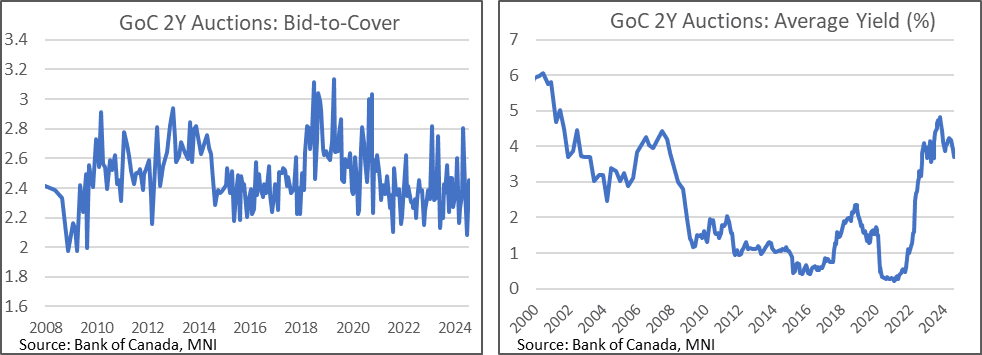
CANADA: 2Y Auction: Bid-To-Cover Recovers From Historical Low
Jul-17 16:11
- Canada sells C$5bn of the 4% Aug 2026 at an average yield of 3.689%.
- The bid-to-cover lifted back to 2.46x as it continues to swing around. Last month’s 2.09x was the lowest since 2009, whilst the five auction average of 2.38x has a range of 2.09-2.81x.
- GoCs have rallied in recent trading but it appears to be driven by volatility in Treasuries. The Can-US 2Y yield differential remains within the week's range, with -66.5bps holding above the low of -72bps fleetingly seen after yesterday's mostly inline Canadian CPI report but strong US retail sales.