BONDS: NZGB Steepening Extends Through The Session
The bear steepening pressure derived from Thursday’s Tsy cheapening extended through the NZ session, with the major NZGB benchmarks running 8-15bp cheaper across the curve at the close.
- Local data had no real impact on the space.
- RBNZ OIS continues to more than fully price a 50bp hike at next week’s decision (albeit with a slight pullback to 51bp of tightening from the 54bp seen early on), with terminal rate pricing continuing to hover around the 4.80% mark.
- Westpac became the latest sell-side to up their terminal rate call, and now expect the OCR to peak at 4.50% in the current cycle, with the RBNZ set to hit that level in February, in their view.
- A quick reminder that all of those surveyed by BBG & RTRS look for the RBNZ to deploy a 50bp hike next week, so the tone of the statement that accompanies the decision will be key (assuming the fully priced and expected 50bp hike is delivered).
Want to read more?
Find more articles and bullets on these widgets:
Historical bullets
USD: Market Insight: USD Momentum Very Elevated, EUR Likely Key To Any Turnaround
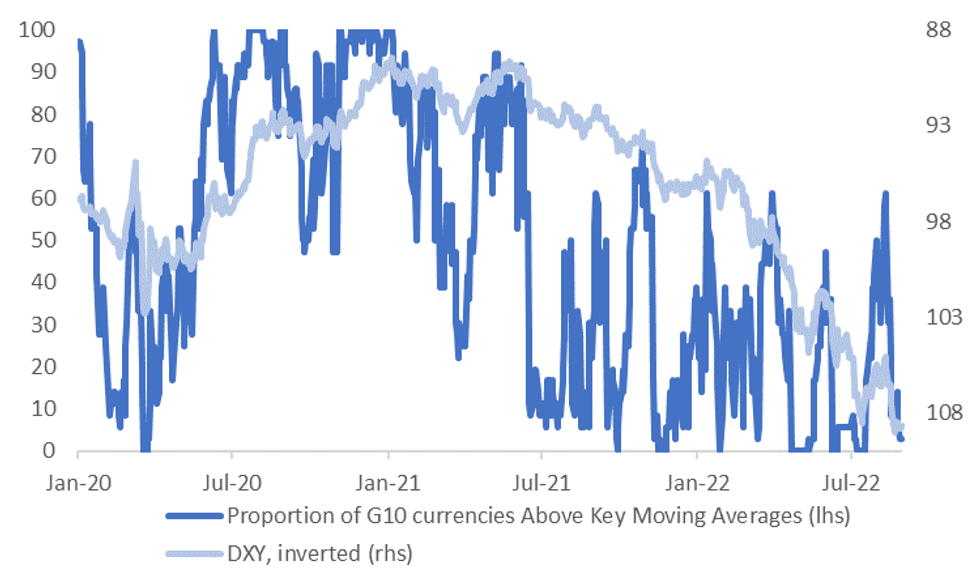
USD momentum remains very strong, at least relative to key moving averages (MA). The first chart below plots the DXY index, which is inverted on chart, against the proportion of G10 currencies which are above key MAs against the USD. This metric looks at whether each G10 currency is above or below its 20, 50, 100 and 200 MA against the USD (see this link for more details on this metric).
- Presently, the G10 currencies only have 1 out of a possible 36 MAs firmer against the USD. This is NOK, which is on the strong side of its 50 day MA.
- Obviously, we are close to the zero bound on this metric, which we have hit on a number of occasions in 2022.
- Interestingly, the DXY has peaked not long after we have hit this zero bound on a number several times this year. This may reflect upside USD momentum running out of steam, or profit-taking flows on long USD positions.
- The exception though was back in late April/early May when the index kept moving higher, although we were at lower levels in the DXY back then compared to now.
- Ultimately shifts lower in the DXY from these peaks have proven to be short lived, before the uptrend resumes once again.
Fig 1: G10 FX Moving Average Momentum & DXY Trend
 Source: MNI - Market News/Bloomberg
- In the current context, any turnaround in USD momentum is likely to be quite EUR dependent. The euro's weight in USD indices is quite high and correlates well with the rest of the G10 bloc.
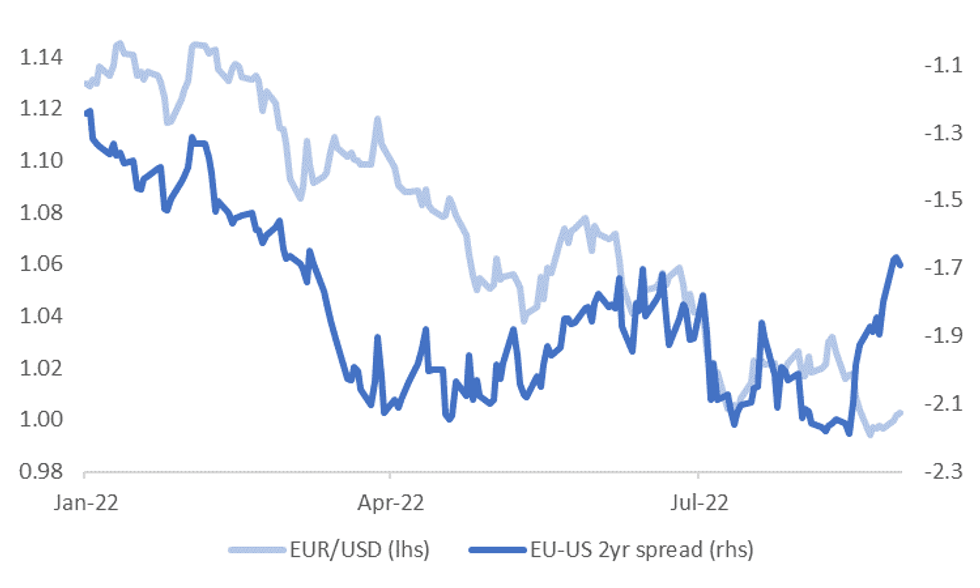
- Some macro drivers have turned less bearish for the EUR, at least in a relative sense. The second chart below plots EUR/USD against the 2yr swap spread with the US.
- Outright spreads are still heavily in favor of the USD (-170bps), but momentum has tilted the other way (+50bps from recent lows). It's a similar backdrop for the relative terms of trade, given recent falls in EU gas prices.
- The 20-day MA for EUR/USD comes in at 1.0111 (versus current spot at 1.0040). Also note we have key event risk later today, with the EU CPI due.
Fig 2: EUR/USD & EU-US 2yr Swap Spread
 Source: MNI - Market News/Bloomberg
BOBL TECHS: (U2) Bearish Outlook Intact
- RES 4: 126.930 High Aug 17
- RES 3: 126.070 High Aug 18
- RES 2: 125.605 50-day EMA
- RES 1: 123.980/124.930 High Aug 30 / High Aug 25
- PRICE: 123.410 @ 05:06 BST Aug 31
- SUP 1: 123.010 Low Jun 30
- SUP 2: 122.022 76.4% retracement of the Jun 16 - Aug 2 rally
- SUP 3: 120.990 Low Jun 21
- SUP 4: 119.940 Low Jun 16
Bobl futures remain bearish and the contract continues to trade at its recent lows. Price has moved further away from the 50-day EMA - the recent break of the average strengthened bearish conditions. The focus is on 123.010 next, the Jun 30 low. Further out, the 120.00 handle beckons. Key short-term resistance has been defined at 124.930, the Aug 25 high. A break of this level is required to ease bearish pressure.
BUND TECHS: (U2) Needle Still Points South
- RES 4: 154.47 High Aug 18
- RES 3: 153.66 High Aug 19
- RES 2: 152.86 50-day EMA
- RES 1: 149.32/151.42 High Aug 30 / High Aug 25
- PRICE: 148.51 @ 05:08 BST Aug 31
- SUP 1: 147.94/92 61.8% of the Jun 16 - Aug 2 bull leg / Low Aug 29
- SUP 2: 146.50 Low Jun 30
- SUP 3: 144.72 Low Jun 28 and a key support
- SUP 4: 143.05 Low Jun 121
Bund futures remain in bear mode and price is trading at the recent lows. The contract is also trading below the 50-day EMA - the average marked a key support area and the recent breach strengthened bearish conditions. The focus is on the 147.94 next, a Fibonacci retracement that was briefly pierced on Monday. A break would open 146.50, the Jun 30 low. On the upside, initial firm resistance is seen at 151.42, Aug 25 high.