US STOCKS: NASDAQ(NQH6) - Is This Top Different ?
The NASDAQ(NQH6) contract overnight range was 24887.75 - 2508.50, Asia is currently trading {NQA Index}. The NASDAQ has put in a lower high now just below 2600 and looks likely to put in a potential top as the worries around certain sectors within AI begins to gather at a worrying pace. The first target looks to be toward the 24000 area, a break below here would signal the correction is about to be a lot deeper. As mentioned before this is not the first time we have seen what looks to be a toppish formation only to see new all-time highs shortly after, but the AI sector as been “Atlas” to the rest of the market and should sentiment towards it change like it seems to be doing, it could signal this time could be different.
- The fate of Nvidia will also have a direct impact on how the NASDAQ and indirectly how risk as a whole holds up, and it too is approaching some pivotal levels that if breached could see the selling pressure increase. A break back below $160-$165 would be problematic. See Fig. 2 Below
- Samantha LaDuc on X: "Before 29 October of 23 AI related US stocks, just one stock was down on the year and the group had posted an average unweighted gain of +70%; since then, the picture has shifted sharply, with 20 of the 23 now trading lower." - DB
- The Nikkei 225 Index Average True Range(ATR) for the last 10 Trading days: 385 Points
Fig 1: NASDAQ 100 Daily Chart
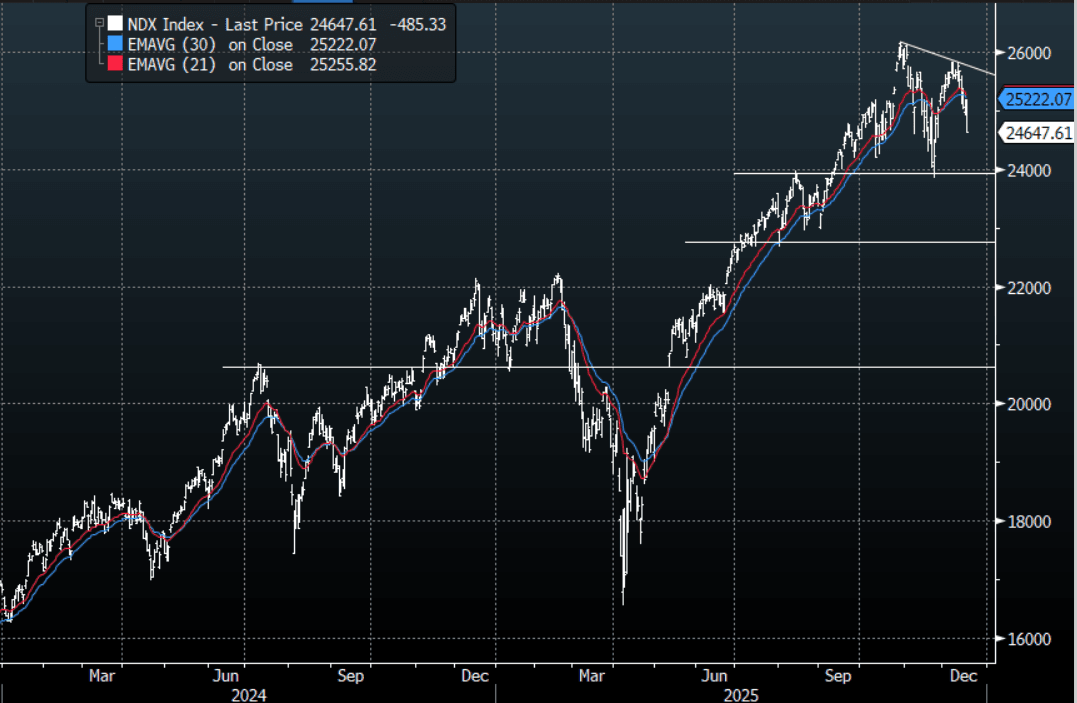
Source: MNI - Market News/Bloomberg Finance L.P
Fig 2: Nvidia Daily Chart
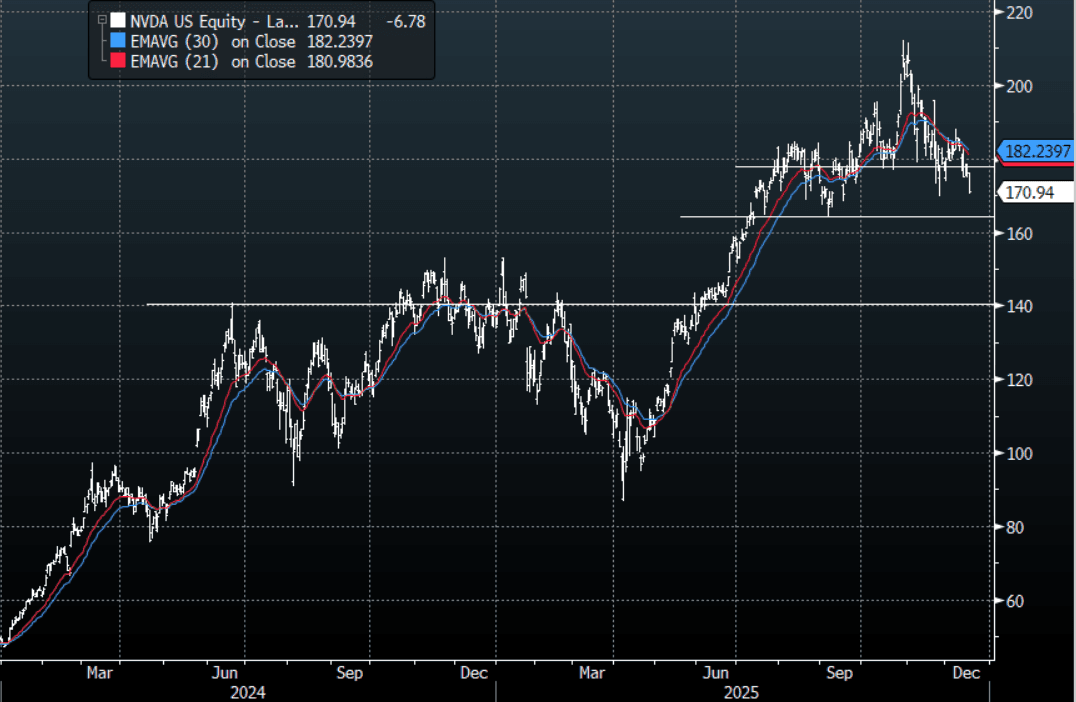
Source: MNI - Market News/Bloomberg Finance L.P
Want to read more?
Find more articles and bullets on these widgets:
Historical bullets
JAPAN: Nikkei(NHZ5) - Stalls Toward 50500 As Risk Stays Under Pressure
The Nikkei(NHZ5) contract overnight range was 49490 - 50495, The Nikkei 225 closed yesterday, -0.10%. The futures took a leg lower in N/Y as risk opened the week back under pressure, it opens in Asia around 49850, +0.15%. The Market technically remains in an uptrend while the support toward 48000-49000 holds, albeit a very steep one. The lower high put on the Daily chart and the headwinds for global risk do give me pause though, in this session I would be looking to sell into the 50150-50350 area if given the chance looking for a test back toward the 48500-4900 support.
Fig 1: Nikkei 225 Daily Chart
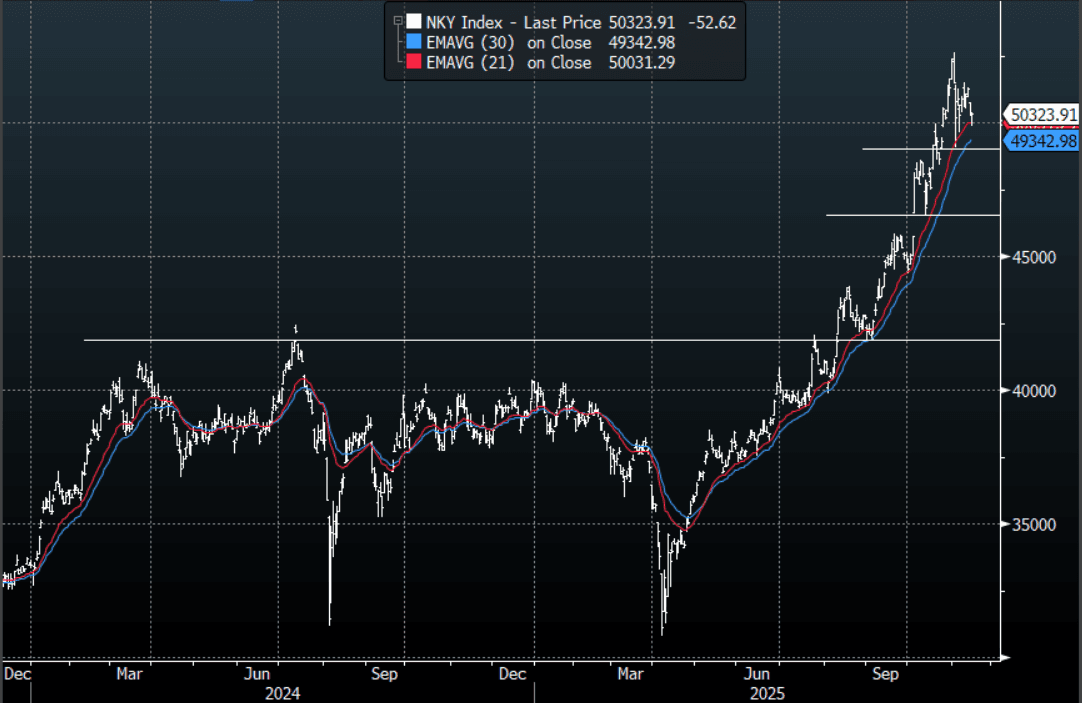
Source: MNI - Market News/Bloomberg Finance L.P
AUSSIE BONDS: ACGB Jun-54 Auction Results
The AOFM sells A$300mn of the 4.75% 21 June 2054 Treasury Bond, #TB169:
- Average Yield (%): 5.0603 (prev. 4.8213)
- High Yield (%): 5.0625 (prev. 4.8250)
- Bid/Cover: 2.8500x (prev. 4.0533x)
- Allotted at Highest Accepted Yld as % of Bid at that Yld (%): 90.6 (prev. 64.7)
- Bidders: 49 (prev. 43), successful 19 (prev. 10), allocated in full 10 (prev. 5)
GOLD: Gold Continues Decline On Fed Uncertainty & Stronger USD
Gold has been pressured by the uncertainty over the 10 December Fed decision given the lack of clarity over the economic situation due to the prolonged government shutdown. On Monday, it was almost 5% below the 13 November peak as the pricing for a December rate cut has trended lower and is now around 45%. Data is gradually being released with Thursday’s September payrolls the focus this week. The stronger US dollar also pressured bullion (BBDXY +0.3%).
- Gold fell 1.0% to $4044.96 on Monday to be up 1.1% in November and has started Tuesday lower at $4037.0. It recovered somewhat from the intraday low at $4007.09, below initial support at $4032.3, 14 November low. A break below the 50-day EMA at $3927.5 would signal scope for a deeper retracement. Initial resistance is at $4264.7.
- FOMC members appear split between believing further easing is needed to restart the labour market and holding as inflation remains above target. The Fed’s Waller noted earlier today that the focus should be on jobs data and not inflation and that the fiscal position is not sustainable (this has been one of the drivers of the gold rally).
- Silver fell 0.7% to $50.220 off the intraday low of $49.581, just below the 20-day EMA at $49.604, and has started today around $49.91. While it is up 3.1% this month, it is over 8% below the 13 November peak. The trend remains bullish though with the bull trigger at $54.480.