SWEDEN: Muted Underlying Inflation Pressures Could Temper Hawkish Repricing
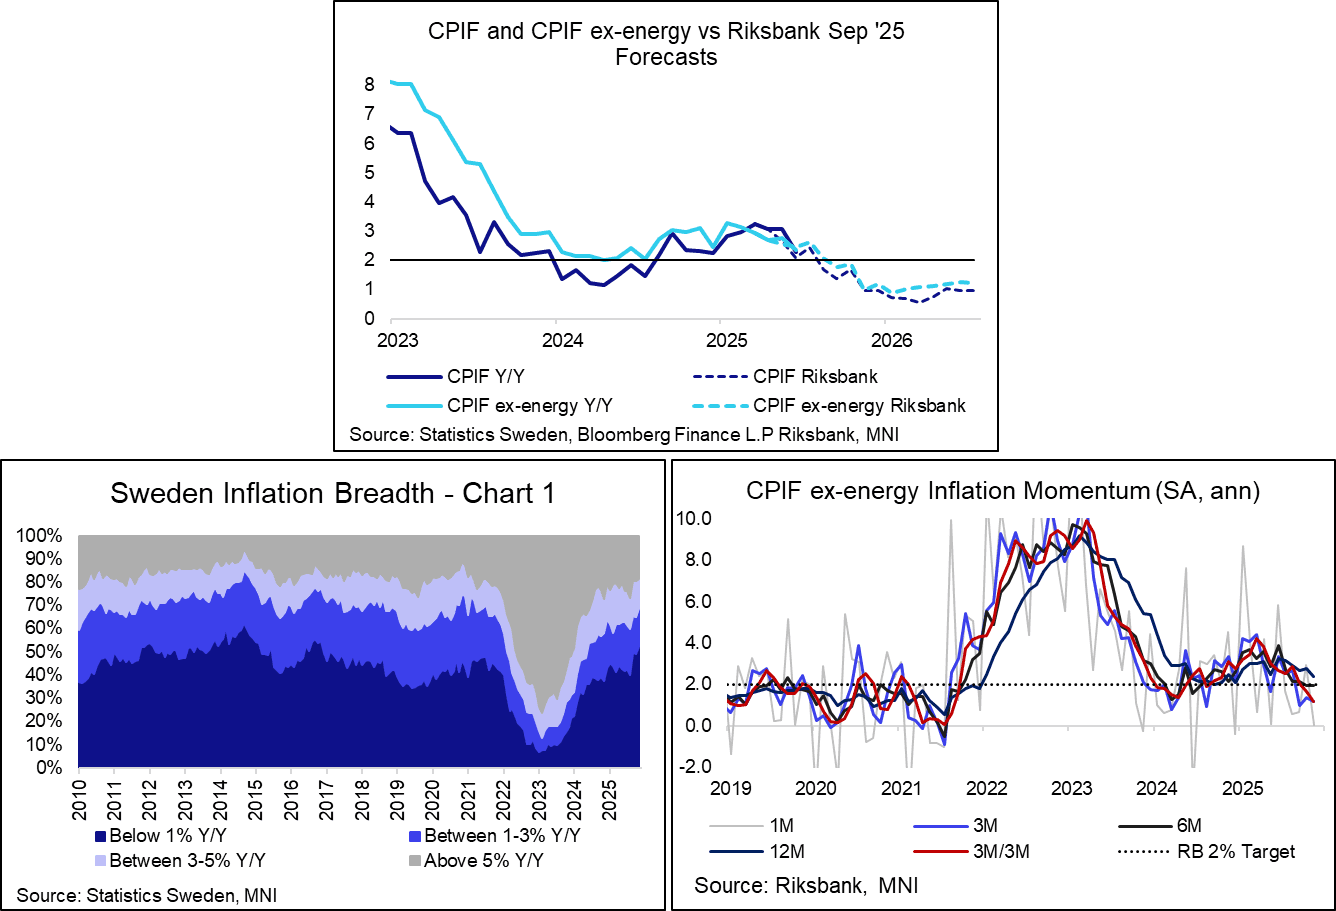
Swedish seasonally adjusted and inflation breadth metrics suggest underlying pressures are muted, which is notable given CPIF ex-energy will mechanically be pulled even lower next year due to the food VAT cut. The Riksbank will likely assume that the ongoing economic recovery will support demand-pull inflation (ex-energy and food) in 2026, keeping the overall outlook consistent with the target. However, if this fails to materialise, and below-target inflation filters into longer-term inflation expectations, it would work against recent hawkish repricing in SEK rates which now fully price a hike by the end of next year.
- On a seasonally adjusted basis using the X-13 methodology, we estimate sequential CPIF ex-energy inflation at 0.00% M/M, an eleven-month low. That pulled 3m/3m annualised inflation down to a multi-year low of 1.17% (vs 1.66% prior).
- The proportion of CPI subcomponents with annual inflation rates below 1% increased to 52%, the most since 2016.
- At the sub-component level, there was a welcomed pullback in food inflation to 2.38% Y/Y (vs 2.82% prior), the lowest since January.
- As anticipated by analysts ahead of the release, there was some unwind in goods inflation, likely owing to Black week/Black Friday. Clothing and footwear inflation was 0.56% Y/Y (vs 1.44% prior). Other recreation and culture goods also eased, alongside vehicle inflation.
- On the services side, recreation and culture services, restaurants and hotels, and insurance inflation were notable downside drivers. Volatile items such as package holidays and airfares also eased.
Want to read more?
Find more articles and bullets on these widgets:
Historical bullets
WTI TECHS: (Z5) Bullish Corrective Cycle
- RES 4: $71.47 - High Jun 23 and a key medium-term resistance
- RES 3: $67.68 - High Jul 30
- RES 2: $65.77/68.43 - High Sep 26 and key resistance
- RES 1: $62.59 - High Oct 24
- PRICE: $59.81 @ 07:19 GMT Nov 11
- SUP 1: $58.83/55.96 - Low Nov 6 / Low Oct 20 and bear trigger
- SUP 2: $54.85 - Low May 5
- SUP 3: $54.16 - Low Apr 9 and a key support
- SUP 4: $53.23 - 1.764 proj of the Jul 30 - Aug 13 - Sep 26 price swing
Recent weakness in WTI futures appears to be a flag formation - a bullish continuation pattern. This suggests that an upward corrective cycle remains intact for now. Price has recently traded through the 50-day EMA, at $60.84, signalling scope for a stronger recovery. Note too that resistance at $62.34, the Oct 8 high, has been pierced. A clear move through it would expose key resistance at $65.77, Sep 26 high. The bear trigger is $55.96, the Oct 20 low.
GOLD TECHS: Recovery Signals The End Of A Corrective Phase
- RES 4: $4404.9 - 3.500 proj of the May 15 - Jun 16 - 30 price swing
- RES 3: $4400.0 - Round number resistance
- RES 2: $4381.5 - High Oct 20 and bull trigger
- RES 1: $4161.4 - High Oct 22
- PRICE: $4130.1 @ 07:25 GMT Nov 11
- SUP 1: $3998.7 - Low Nov 10
- SUP 2: $3890.0 - 50-day EMA
- SUP 3: $3800.00 Round number support
- SUP 4: $3751.3 - 50.0% retracement of the May 15 - Oct 20 bull leg
The downleg in Gold since Oct 20 appears to have been a correction and has allowed an overbought condition to unwind. Recent gains also suggest the correction is over. Price remains above a key support at the 50-day EMA, at $3890.0.0. Clearance of this EMA would signal scope for a deeper retracement. Initial resistance is at $4161.4, the Oct 22 high. A stronger recovery would refocus attention on $4381.5, the Oct 20 high and bull trigger.
BRENT TECHS: (F6) Bull Flag Formation
- RES 4: $71.45 - 76.4% retracement of the Jun 23 - Oct 20 bear leg
- RES 3: $70.69 - High Jul 30
- RES 2: $69.29 - High Sep 26 and a key resistance
- RES 1: $65.98 - High Oct 9
- PRICE: $63.79 @ 07:08 GMT Nov 11
- SUP 1: $62.84/59.97 - Low Nov 6 / 20 and the bear trigger
- SUP 2: $58.72 - Low May 5
- SUP 3: $57.99 - Low Apr 9 and a key support
- SUP 4: $56.05 - 2.00 proj of the Jul 30 - Aug 13 - Sep 26 price swing
Recent activity in Brent futures appears to be a flag formation - a bullish continuation pattern. This suggests that a corrective cycle remains intact for now. Price has recently traded through the 50-day EMA, at $64.56. Clearance of this hurdle signals scope for a stronger recovery. The next resistance to monitor is $65.98, the Oct 9 high. A clear breach of it would expose a key resistance at $69.29, the Sep 26 high. Key support lies at $59.97, Oct 20 low.