US: MNI POLITICAL RISK - European Leaders Line Up Behind Ukraine
Aug-13 12:35
Download Full Report Here
- At 11:15 ET 16:15 BST, Trump will deliver remarks at the Kennedy Center. He is expected to announce annual honours recipients, but could touch on other market-relevant issues. Trump will sign Executive Orders at 16:00 ET 21:00 BST.
- As of this morning, the National Guard has deployed across DC.
- At 09:00 ET 14:00 BST, Trump will join Ukrainian President Volodymyr Zelenskyy and European leaders for an emergency virtual summit to discuss Trump’s upcoming meeting with Russian President Vladimir Putin. We have a rundown of what to expect inside.
- Treasury Secretary Scott Bessant said the Fed should be open to a 50 basis-point cut in the benchmark interest rate. Bessent said he hopes CEA Chair Stephen Miran will be confirmed to the Fed board in time for the September policy meeting.
- Trump’s nominee to lead the BLS, EJ Antoni, has received a lukewarm reception from economists across the political spectrum. Antoni faces an uncertain Senate confirmation process.
- The Republican Chair of the House Select Committee on China criticised Trump’s semiconductor revenue-sharing deal.
- Former Democratic Senator Sherrod Brown confirmed he will run for re-election, boosting Democrats’ long-shot chance of flipping the Senate.
- The State Department's human rights report on Brazil highlights domestic political issues that the Trump administration used to justify a 50% tariff rate.
- Poll of the Day: Small business optimism rose in July to slightly above the 52-year average.
Full Article: US DAILY BRIEF
Want to read more?
Find more articles and bullets on these widgets:
Historical bullets
MNI: CANADA MAY WHOLESALE SALES -0.5%; EX-AUTOS -0.4%
Jul-14 12:30
- MNI: CANADA MAY WHOLESALE SALES -0.5%; EX-AUTOS -0.4%
- MAY WHOLESALE INVENTORIES -0.3%: STATISTICS CANADA
- CANADA MAY WHOLESALES EX-PETROLEUM/OILSEED/GRAIN +0.1%
US TSYS: Early SOFR/Treasury Options Roundup
Jul-14 12:25
SOFR & Treasury option trade mixed overnight, Sep'25 call condor highlight limited SOFR volumes. Underlying futures inching off late overnight lows, curves adding to Fri's steepening (2s10s +1.552 at 53.568). Projected rate cut pricing has cooled slightly vs late Friday (*) levels: Jul'25 at -1.7bp, Sep'25 at -15.9bp (-17bp), Oct'25 at -30.7bp (-31.7bp), Dec'25 at -49.1bp (-49.6bp).
- SOFR Options:
- 2,400 0QV5 96.81 straddles ref 96.785
- 4,000 0QQ5 96.87/97.00/97.12 call flys, 1.0 ref 96.735 to -.74
- 1,000 SFRU5 95.81/95.87/96.18 broken call trees, 0.75 ref 95.855
- Block/screen, +8,000 SFRU5 95.87/96.00/96.06/96.18 call condors, 2.75 ref 95.855
- Treasury Options:
- 5,000 TYU5 112 calls, 25
- 5,800 TYU5 109 puts, 15 ref 110-25 to -24.5
- -2,000 TYV5 110.5 straddles, 218, ref 110-22
- 2,300 wk3 FV 108.5/109 call spds, 4.5 ref 108-05.5 (exp 7/18)
- +1,000 TYQ5 109/109.75/110.5 put flys, 9 vs. 110-23/0.11%
- -2,100 TYQ5 110.75 calls, 26 ref 110-23.5/0.52%
- -1,670 TYQ5 110/111 put spds, 25 ref 110-25.5/0.57%
- 2,000 TYU5 110 puts, 31
- +2,000 Wednesday wkly TY 112 calls, 1
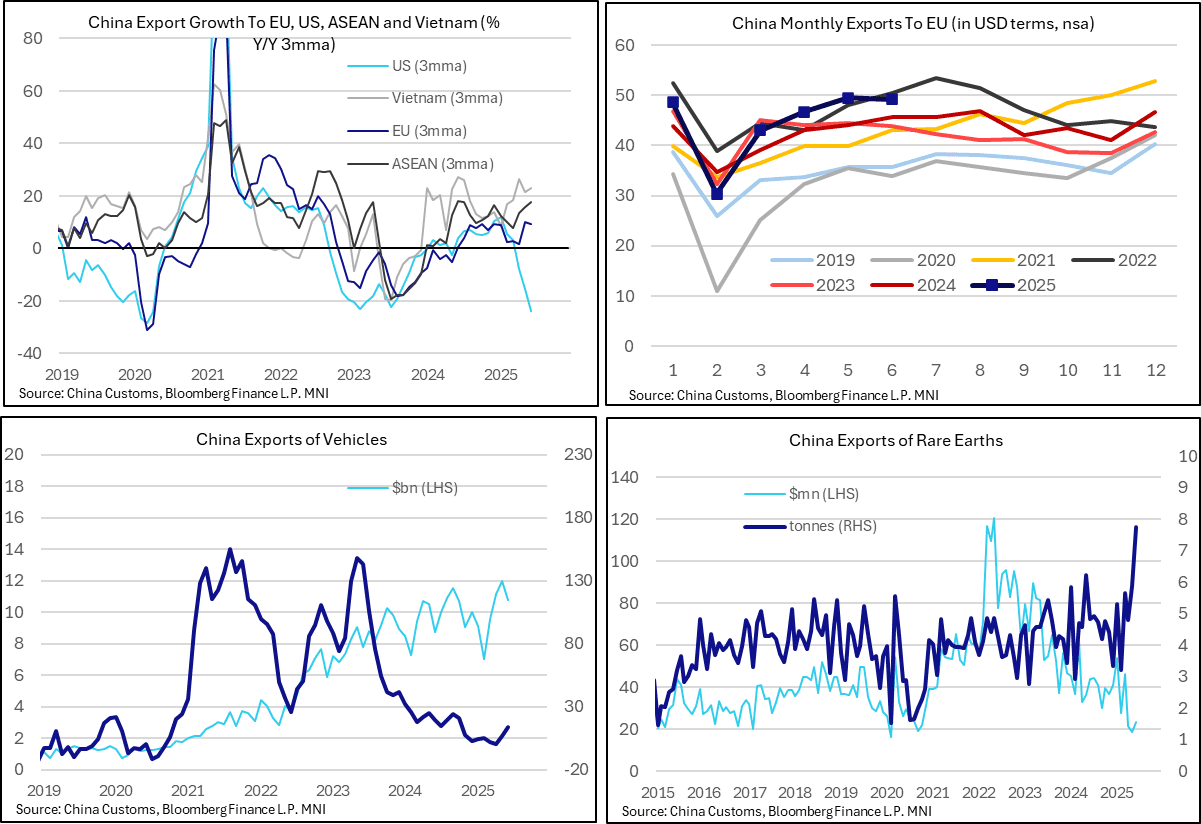
INTERNATIONAL TRADE: Still No Clear Signs Of China-EU Trade Diversion In June
Jul-14 12:19
Chinese trade data continues to suggest that transhipments into the US via third countries such as Vietnam is a more clearly observable dynamic than disinflationary trade diversion to the likes of the EU.
- Last week, we highlighted the strength of Vietnamese and Taiwanese exports to the US in June, with import growth from China simultaneously rising. Chinese trade data for June unsurprisingly corroborates these themes.
- Direct exports to the US fell 16.1% Y/Y (vs 34.4% prior) in June. On a 3mma Y/Y basis, export growth to the US was -23.8%, the weakest since April 2020.
- Meanwhile, exports to the EU totalled USD49.2bln (vs USD49.5bln in May). That’s still growth of 7.6% Y/Y (vs 12.1% prior), and a 3mma Y/Y rate of 9.3%. However, the figures do not stand out as seasonally strong, but rather in line with the consistent growth in Chinese exports to Europe over the past few years.
- In its latest report on the sustained decline in German export market shares, the Bundesbank noted that in recent years, “China increasingly emerged as a competitor of German firms.”…“Since 2019, in dealings with its most important trading partners, the German export industry has tended to lose more market share in the very areas where China has gained ground,”
- Chinese global vehicle exports totalled USD10.7bln in June, up 23.1% Y/Y (vs 13.7% prior). Vehicle exports have been on a consistent upward trend since 2021. According to Eurostat data, EU road vehicles imports from China totalled E2.2bln in April.
- June trade data also indicated a sharp rise in the volume of Chinese rare earth exports to 7,742 tons (up 60% Y/Y). However, the value of rare earth exports was still down 46.9% Y/Y at USD23.2mln. A reminder that the China/US trade framework struck in Vienna in May (and then finalised in London in June) included a commitment from China to deliver rare earths to the US.