EM ASIA CREDIT: MNI EM Credit Market Update - Asia
Asia EM USD sovereign and agency spreads are mostly 1–3bp tighter today, with Thailand the outlier, a couple of basis points wider after the deputy finance minister highlighted the need to maintain currency stability. Regional equities are higher, led by the KOSPI (+2.8%) with SK Square (+17%) and SK Hynix (+11%) rallying after SK Hynix struck a chip supply deal with OpenAI for its Stargate data centres. Separately, Moody’s revised JSW Steel’s outlook to positive from stable as leverage is expected to keep improving. No new issuance reported.
Want to read more?
Find more articles and bullets on these widgets:
Historical bullets
JGBS AUCTION: 10-Year JGB Auction Results
The Japanese Ministry of Finance (MoF) sells Y 2.0206trln 10-Year JGBs:
- Average Yield: 1.6120% (prev. 1.462%)
- Average Price: 99.05 (prev. 100.32)
- High Yield: 1.6190% (prev. 1.479%)
- Low price: 98.99 (prev. 100.18)
- % Allotted At High Yield: 17.534% (prev. 86.7516%)
- Bid/Cover: 3.92 (prev. 3.0592x)
US: Trump To Declare A National Housing Emergency
President Trump is potentially about to declare a national housing emergency, why is this ? Below are some excerpts related to the overnight announcement:
- US (MNI): Trump May Declare National Housing Emergency In Fall - Bessent. US Treasury Secretary Scott Bessent told the Washington Examiner that President Donald Trump may declare a 'national housing emergency' this fall to address rising house prices. The Washington Examiner notes that there hasn't been a national housing emergency declared since the 2008 recession.
- John Wake on X: "Homebuilder inventory hits 2009 levels". https://t.co/FIEJgJSKnx. See Graph Below.
- Bob Elliott on X: ”Low activity and falling prices suggests the housing market is cracking at this point.”
- EndGame Macro on X: “We’re now back to the highest level of completed but unsold homes since 2009. Historically, when completed inventory rises this sharply, it’s a sign that demand is failing to keep pace. Builders don’t like to sit on finished product because every unsold house ties up capital and financing costs. The last time we saw this dynamic in 2006–2009, the oversupply collided with weakening demand and set up a multi year price correction.”
- “Based on historical precedent, inventories at this level almost always mark the start of builders offering discounts, incentives, and eventually price cuts to clear supply. In 2009, unsold inventory peaked just before the steepest leg down in home values. Today isn’t identical, credit quality is stronger, but debt loads, economic strain, and demographic headwinds point to the same pressure.”
- “Going forward, the most likely scenario is a correction, not a rebound. Housing cycles take years to play out, and this chart suggests we’re entering the phase where supply begins to overwhelm demand.” See Graph below.
- Thomas Thornton on X: “Either prices are too high or rates are too high. Lower rates artificially and will see higher home prices. You want both lower at the same time, let a recession happen.”
Fig 1: Number of Unsold Completed Homes For Sale
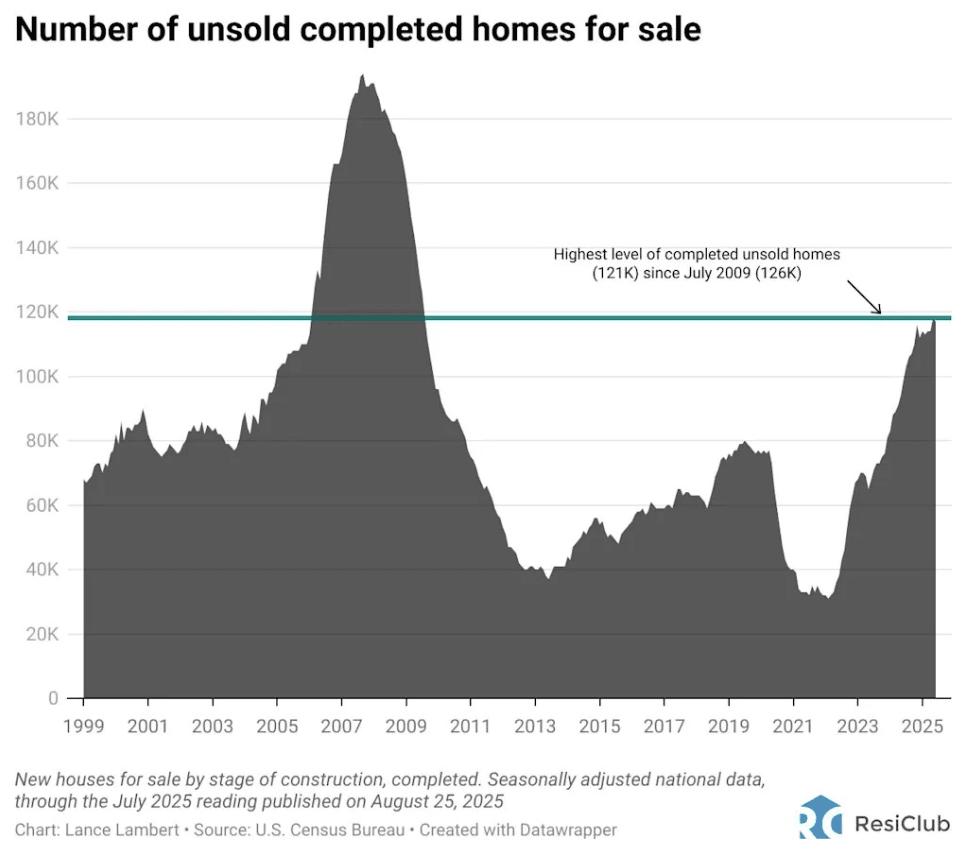
Source: MNI - Market News/@JohnWake
INDONESIA: VIEW: UOB Sees Inflation Picking Up
August headline and core inflation printed below the mid-point of Bank Indonesia’s (BI) 1.5-3.5% band. UOB warns that price pressures could “accelerate due to continued increases in gold prices and demand, rising food prices, and higher demand for non-subsidized fuel amid supply constraints”. There is also an inflationary risk from US tariffs. It is forecasting Indonesian inflation to average 2.2% in 2025 picking up to 2.5% in 2026.
- UOB notes that “Indonesia’s inflation held steady at 2.31% y/y in August, supported by rising food prices—especially rice, eggs, and cooking oil. Volatile food inflation reached 4.47% y/y, outpacing core and administered components.”
- “Inflation declined -0.8% m/m, led by lower airfares and communication equipment prices. Energy deflation also contributed, following non-subsidized fuel price adjustments. The Personal Care & Other Services category surged 8.66% y/y due to rising gold prices.”
- “Transportation costs contributed to the monthly decline, particularly airfares, which were discounted during Indonesia’s Independence Day celebrations.”
- “On the energy front, deflation was observed due to adjustments in non-subsidized fuel prices.”