MNI DAILY TECHNICAL ANALYSIS - USDJPY Bull Cycle Concludes
Price Signal Summary – USDJPY Bull Cycle Concludes
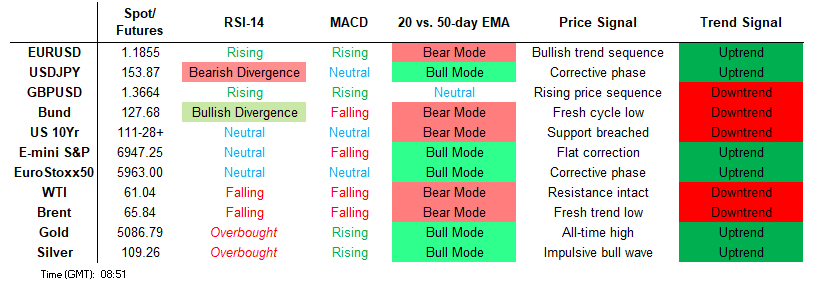
- The trend structure in S&P E-Minis remains bullish and the pullback between Jan 13 - 21 appears to have been a correction. The bounce off last Wednesday’s low signals the end of the corrective phase. A medium-term bull cycle in EUROSTOXX 50 futures is intact and last week’s volatile activity is considered corrective. The next important support to monitor lies at the 50-day EMA at 5827.25.
- GBPUSD continues to appreciate. Friday’s strong gains confirm a resumption of the uptrend that has been in place since early November last year. The sharp pullback in USDJPY brings to an end the recent bull cycle and marks the start of a corrective phase. A sharp reversal Friday and today’s follow through has seen the pair trade through both the 20- and 50-day EMAs. AUDUSD gains last week strengthen a bullish theme and highlight an acceleration of the uptrend. Moving average studies are in a bull-mode position too, reinforcing current trend conditions.
- The primary uptrend in Gold remains intact. The extension higher, confirms a resumption of the uptrend and maintains the price sequence of higher highs and higher lows. The psychological $5000.0 level has been cleared. A bull cycle in WTI futures remains intact for now and sights are on the bull trigger at $62.20, the Jan 14 high. Clearance of this hurdle would confirm a resumption of the uptrend.
- Bund futures are trading closer to their recent lows. The latest pullback highlights a potential reversal. Support at 127.70, the Jan 9 low, has been breached, the clear break of it strengthens a reversal threat. Gilt futures maintain a softer short-term tone following the pullback from the Jan 14 high. The move down has resulted in a break of support around the 20-day EMA, at 91.73.
[GLOBAL] MNI Tech Trend Monitor - Highlighting Longer-Term Trends:
- Refreshing the MNI Tech Trend Monitor, Adding USDZAR, USDCNH and the e-mini S&P chart, while refreshing levels for Gold, USD/JPY, EUR/GBP, EUR/HUF, USD/MXN, the European Banking Stock Index (SX7E) as well as UK Gilts.
See full document here: https://media.marketnews.com/MNI_Tech_Trend_Monitor_Jan26_cef40b4ef1.pdf
FOREIGN EXCHANGE
EURUSD TECHS: Impulsive Bull Cycle
- RES 4: 1.2006 High Jun 17 2021
- RES 3: 1.1958 2.500 proj of the Nov 5 - 13 - 21 price swing
- RES 2: 1.1919 High Sep 17 and a key M/T resistance
- RES 1: 1.1898 Intraday high
- PRICE: 1.1865 @ 06:02 GMT Jan 26
- SUP 1: 1.1808 High Dec 24
- SUP 2: 1.1768 High Jan 20
- SUP 3: 1.1699 20-day EMA
- SUP 4: 1.1670 Low Jan 22
A strong bull cycle in EURUSD is in play and Friday’s rally through resistance at 1.1808, the Dec 24 high, strengthens current bullish conditions. Attention is on the next important resistance at 1.1919, the Sep 17 high and a key medium-term hurdle for bulls. Clearance of this level would open 1.1958, a Fibonacci projection. The short-term trend is overbought, a pullback would allow this condition to unwind.
GBPUSD TECHS: Strong Rally
- RES 4: 1.3835 High Oct 20 2021
- RES 3: 1.3789 High Jul 1 ‘25 and a key medium-term resistance
- RES 2: 1.3726 High Sep 17 and a key resistance
- RES 1: 1.3683 Intraday high
- PRICE: 1.3658 @ 06:15 GMT Jan 26
- SUP 1: 1.3568 High Jan 6 and a recent breakout level
- SUP 2: 1.3456 20-day EMA
- SUP 3: 1.3406 50-day EMA
- SUP 4: 1.3331 Low Jan 19 and the bear trigger
GBPUSD continues to appreciate. Friday’s strong gains confirm a resumption of the uptrend that has been in place since early November last year. Attention is on the next important resistance at 1.3726, the Sep 17 high. Clearance of this level would open 1.3789, the Jul 1 high and a key medium-term resistance. Initial firm support lies at 1.3456, the 20-day EMA. A pullback would allow an overbought condition to unwind.
EURGBP TECHS: Support Remains Exposed
- RES 4: 0.8813 76.4% retracement of the Nov 14 - Jan 6 bear leg
- RES 3: 0.8797 High Dec 17
- RES 2: 0.8781 61.8% retracement of the Nov 14 - Jan 6 bear leg
- RES 1: 0.8716/46 50-day EMA / High Dec 31 & Jan 21
- PRICE: 0.8678 @ 06:30 GMT Jan 26
- SUP 1: 0.8644 Low Jan 6 and the bear trigger
- SUP 2: 0.8633 Low Sep 15
- SUP 3: 0.8620 38.2% retracement of the Dec ‘24 - Nov ‘25 bull cycle
- SUP 4: 0.8597 Low Aug 14
Friday’s sell-off in EURGBP signals the potential end of a corrective recovery between Jan 6 - 21. Note that moving average studies are in a bear-mode set-up and this continues to suggest that recent short-term gains are corrective. Key support and the bear trigger lies at 0.8644, the Jan 6 low. A break of this level would confirm a resumption of the downtrend. Key short-term resistance is 0.8746, the Jan 21 high.
USDJPY TECHS: Reversal Marks The Start Of A Corrective Phase
- RES 4: 159.45 High Jan 14 and a key resistance
- RES 3: 157.42 20-day EMA
- RES 2: 156.24 50-day EMA
- RES 1: 155.35 Intraday high
- PRICE: 153.79 @ 08:46 GMT Jan 26
- SUP 1: 153.40 Intraday low
- SUP 2: 152.82 Low Nov 7 ‘25
- SUP 3: 151.98 38.2% of the Apr 22 ‘25 - Jan 14 bull cycle
- SUP 4: 150.99 Trendline support drawn from the Apr 22 ‘25 low
The sharp pullback in USDJPY brings to an end the recent bull cycle and marks the start of a corrective phase. A sharp reversal Friday and today’s follow through has seen the pair trade through both the 20- and 50-day EMAs. This signals scope for a deeper retracement and potential is seen for a move towards 151.98, a Fibonacci retracement. Initial resistance to watch is 156.24, the 50-day EMA.
EURJPY TECHS: Short-Term Reversal
- RES 4: 188.65 3.236 proj of the Oct 17 - Oct 30 - Nov 5 price swing
- RES 3: 187.67 Bull channel top drawn from the Feb 28 ‘25 low
- RES 2: 186.87 High Jan 23 and the bull trigger
- RES 1: 184.16 20-day EMA
- PRICE: 182.32 @ 08:46 GMT Jan 26
- SUP 1: 181.92 Intraday low
- SUP 2: 181.57 Low Dec 17
- SUP 3: 180.50 Low Dec 8
- SUP 4: 179.54 Base of a bull channel drawn from the Feb 28 ‘25 low
A reversal off Friday’s high in EURJPY highlights a short-term top. The cross has breached the 20-day EMA and sights are on support around the 50-day EMA, at 182.53 (pierced). A clear breach of the 50-day average would signal a stronger reversal and open 181.57, the Dec 17 low. For bulls, a resumption of gains would refocus attention on Friday’s high and bull trigger, at 186.87. A break of this hurdle would reinstate the recent uptrend.
AUDUSD TECHS: Trend Needle Points North
- RES 4: 0.7022 1.618 proj of the Nov 21 - Dec 10 - 18 price swing
- RES 3: 0.6991 1.500 proj of the Nov 21 - Dec 10 - 18 price swing
- RES 2: 0.6942 High Sep 30 2024 and a key resistance
- RES 1: 0.6935 Intraday high
- PRICE: 0.6912 @ 08:07 GMT Jan 26
- SUP 1: 0.6834 Low Jan 23
- SUP 2: 0.6728 20-day EMA
- SUP 3: 0.6667 50-day EMA
- SUP 4: 0.6593 Low Dec 18
AUDUSD gains last week strengthen a bullish theme and highlight an acceleration of the uptrend. Moving average studies are in a bull-mode position too, reinforcing current trend conditions. Sights are on 0.6942 next, the Sep 30 2024 high and a key resistance. The trend is overbought and any pullback would allow this condition to unwind. Firm support to watch lies at 0.6728, the 20-day EMA.
USDCAD TECHS: Approaching The Bear Trigger
- RES 4: 1.3929 High Jan 16 and a reversal trigger
- RES 3: 1.3879 High Jan 20
- RES 2: 1.3846 50-day EMA
- RES 1: 1.3820 20-day EMA
- PRICE: 1.3693 @ 08:19 GMT Jan 26
- SUP 1: 1.3675 Intraday low
- SUP 2: 1.3643 Low Dec 26 and the bear trigger
- SUP 3: 1.3576 Low Jul 23 ‘25
- SUP 4: 1.3540 Low Jun 16 and a key medium-term support
A sharp sell-off in USDCAD on Friday cancels a recent bull theme and instead highlights a resumption of the bear leg that started on Nov 5 ‘25. Sights are on the next key support and bear trigger at 1.3643, the Dec 26 low. A break of this level would strengthen a bear theme and open 1.3567, the Jul 23 ‘25 low. On the upside, key short-term resistance to monitor is 1.3846, the 50-day EMA.
FIXED INCOME
BUND TECHS: (H6) Trading Closer To Its Recent Lows
- RES 4: 129.24 High Dec 1
- RES 3: 128.89 61.8% retracement of the Nov 26 - Dec 22 bear leg
- RES 2: 128.75 High Dec 3
- RES 1: 128.21/58 50-day EMA / High Jan 19
- PRICE: 127.68 @ 05:32 GMT Jan 26
- SUP 1: 127.51 Low Jan 23
- SUP 2: 127.13/126.75 Low Jan 6 / Low Dec 22 and the bear trigger
- SUP 3: 126.53 Low Mar 11 (cont.) and a key support
- SUP 4: 126.35 3.236 projection of the Nov 12 - 20 - 26 price swing
Bund futures are trading closer to their recent lows. The latest pullback highlights a potential reversal. Support at 127.70, the Jan 9 low, has been breached, the clear break of it strengthens a reversal threat and opens 127.13 next, the Jan 6 low. Key short-term resistance is at 128.58, the Jan 19 high. For bulls, a resumption of recent gains and a breach of this level would reinstate the recent uptrend.
BOBL TECHS: (H6) Bearish Theme
- RES 4: 116.960 High Dec 1
- RES 3: 116.805 76.4% retracement of the Nov 26 - Dec 10 bear leg
- RES 2: 116.720 High Dec 4
- RES 1: 116.640 High Jan 19
- PRICE: 116.250 @ 06:24 GMT Jan 26
- SUP 1: 116.140 Low Jan 23
- SUP 2: 115.920 Low Jan 5
- SUP 3: 115.780 Low Dec 22
- SUP 4: 115.720 Low Dec 10 and the bear trigger
The trend set-up in Bobl futures is unchanged, the condition remains bearish. Friday’s move below support at 116.240, the Jan 9 low, highlights a potential reversal and if correct, the end of the corrective cycle between Dec 10 - Jan 19. A continuation lower would open 115.92 next, the Jan 5 low. Key short-term resistance has been defined at 116.64, the Jan 19 high. A break of this level is required to reinstate a bullish theme.
SCHATZ TECHS: (H6) Breaches Support
- RES 4: 107.000 Round number resistance
- RES 3: 106.959 76.4% retracement of the Nov 21 - Dec 10 bear leg
- RES 2: 106.945 High Dec 3
- RES 1: 106.824/935 20-day EMA / High Jan 21 and the bull trigger
- PRICE: 106.795 @ 06:15 GMT Jan 23
- SUP 1: 106.760 Low Jan 23
- SUP 2: 106.725 Low Jan 5
- SUP 3: 106.690 Low Dec 18 & 22
- SUP 4: 106.630 Low Dec 10 and the bear trigger
A bear theme in Schatz futures remains intact and the bull cycle since Dec 10 is considered corrective. A key short-term support at 106.790, the Jan 9, 16 and 22 low, has been breached and this signals the end of the recent corrective phase between Dec 10 and Jan 21. A continuation lower would open 106.725, the Jan 5 low. Key short-term resistance and the bull trigger has been defined at 106.935, the Jan 21 high.
GILT TECHS: (H6) Pierces Trendline Support
- RES 4: 93.06 1.382 proj of the Nov 19 - 27 - Dec 16 price swing
- RES 3: 92.95 High Jan and a key resistance
- RES 2: 92.51 High Jan 19
- RES 1: 92.13 High Jan 22
- PRICE: 91.47 @ Close Jan 26
- SUP 1: 91.12 Trendline support drawn from the Nov 19 low
- SUP 2: 90.94 Low Jan 23
- SUP 3: 90.70 Low Jan 2
- SUP 4: 90.50 Low Dec 16 and a key support
Gilt futures maintain a softer short-term tone following the pullback from the Jan 14 high. The move down has resulted in a break of support around the 20-day EMA, at 91.73. This undermines the recent bull theme and signals scope for a deeper retracement. Attention is on 91.12, a trendline support drawn from the Nov 19 low. It has been pierced, a clear break would open 90.70, the Jan 2 low. Initial resistance is at 92.13, last Thursday’s high.
BTP TECHS: (H6) Trendline Support Remains Intact For Now
- RES 4: 121.87 2.000 proj of the Dec 10 - 17 - 22 price swing
- RES 3: 121.58 1.764 proj of the Dec 10 - 17 - 22 price swing
- RES 2: 121.37 High Nov 13
- RES 1: 121.24 High Nov 26 and Jan 19
- PRICE: 120.79 @ 07:07 GMT Jan 26
- SUP 1: 120.36/16 Low Jan 20 / Trendline drawn from the Dec 10 low
- SUP 2: 119.45 Low Dec 22
- SUP 3: 119.13 Low Dec 10 and the bear trigger
- SUP 4: 118.00 Round number support
A bullish theme in BTP futures remains intact. However, the latest sell-off does undermine this bull cycle and the contract has pierced the 20-day EMA, currently at 120.60. A continuation lower would pave the way for a move towards 120.16, a short-term trendline support drawn from the Dec 10 low. For bulls, a resumption of gains and would refocus attention on 121.37 next, the Nov 13 high.
EQUITIES
EUROSTOXX50 TECHS: (H6) Trading Above Support
- RES 4: 6134.00 1.382 proj of the Nov 21 - Dec 12 - 18 price swing
- RES 3: 6100.00 Round number resistance
- RES 2: 6086.99 1.236 proj of the Nov 21 - Dec 12 - 18 price swing
- RES 1: 5996.00/6072.00 High Jan 22 / High Jan 14 & 15
- PRICE: 5957.00 @ 07:03 GMT Jan 26
- SUP 1: 5838.00 Low Jan 20
- SUP 2: 5827.25 50-day EMA
- SUP 3: 5750.00 Low Dec 23
- SUP 4: 5689.00 Low Dec 18
A medium-term bull cycle in EUROSTOXX 50 futures is intact and last week’s volatile activity is considered corrective. The next important support to monitor lies at the 50-day EMA at 5827.25. A clear breach of this average would signal scope for a deeper retracement. Moving average studies are in a bull-mode position, highlighting a dominant uptrend. Key resistance and the bull trigger is at 6072.00, the Jan 14 / 15 high.
E-MINI S&P: (H6) Bullish Theme Intact
- RES 4: 7100.00 Round number resistance
- RES 3: 7080.92 0.764 proj of the Nov 21 - Dec 11 - 18 price swing
- RES 2: 7036.25 High Jan 13
- RES 1: 6983.92 76.4% retracement of the Jan 13 - Jan 21 bear leg
- PRICE: 6939.50 @ 07:26 GMT Jan 26
- SUP 1: 6879.00/6814.50 Low Jan 26 / 21 and bear trigger
- SUP 2: 6809.62 50.0% retracement of the Nov 21 - Jan 13 bull phase
- SUP 3: 6771.50 Low Dec 18 and a key support
- SUP 4: 6756.14 61.8% retracement of the Nov 21 - Jan 13 bull phase
The trend structure in S&P E-Minis remains bullish and the pullback between Jan 13 - 21 appears to have been a correction. The bounce off last Wednesday’s low signals the end of the corrective phase. Price has traded above the 50- and 20-day EMAs. A continuation higher would expose key resistance and the bull trigger at 7036.25, the Jan 13 high. The bear trigger lies at 6814.50, the Jan 21 low.
COMMODITIES
BRENT TECHS: (H6) Trend Condition Remains Bullish
- RES 4: $70.06 - High Jul 30
- RES 3: $68.58 - High Sep 26
- RES 2: $67.92 - 61.8% retracement of the Jun 23 - Dec 16 bear leg
- RES 1: $66.82 - High Jan 14
- PRICE: $66.29 @ 07:16 GMT Jan 26
- SUP 1: $62.90/59.75 - 50-day EMA / Low Jan 5
- SUP 2: $58.53 - Low Dec 16
- SUP 3: $58.27 - Low Apr 9 and a key support
- SUP 4: $57.87 - 1.764 proj of the Jul 30 - Aug 13 - Sep 26 price swing
A short-term bull theme in Brent futures remains intact and recent weakness appears to have been a correction. Initial support to watch lies at $62.90, the 50-day EMA. A break of this level would undermine the bullish theme and highlight a potential reversal. On the upside, sights are on $66.82, the Jan 14 high and a short-term bull trigger. Clearance of this level would open $68.58, the Sep 26 high.
WTI TECHS: (H6) Trend Set-Up Remains Bullish
- RES 4: $66.49 - High Jul 30
- RES 3: $64.75 - High Sep 26
- RES 2: $62.41 - 76.4% retracement of the Sep 26 - Dec 16 downleg
- RES 1: $62.20 - High Jan 14
- PRICE: $61.32 @ 07:24 GMT Jan 26
- SUP 1: $58.79 - 50-day EMA
- SUP 2: $54.84 - Low Dec 16
- SUP 3: $54.56 - Low Apr 9 ‘25 and a key support
- SUP 4: $54.08 - 1.764 proj of the Jul 30 - Aug 13 - Sep 26 price swing
A bull cycle in WTI futures remains intact for now and sights are on the bull trigger at $62.20, the Jan 14 high. Clearance of this hurdle would confirm a resumption of the uptrend that has been in place since Dec 16 and open $62.41 initially, a Fibonacci retracement point. Initial firm support lies at $58.79, the 50-day EMA. A break of this average would signal a potential reversal.
GOLD TECHS: Is Through The Psychological $5000.0 Handle
- RES 4: $5248.1 - 1.764 proj of the Nov 18 - Dec 26 - Dec 31 swing
- RES 3: $5200.0 - Round number resistance
- RES 2: $5167.5 - 1.618 proj of the Nov 18 - Dec 26 - Dec 31 swing
- RES 1: $5111.1 - Intraday high
- PRICE: $5090.3 @ 07:14 GMT Jan 26
- SUP 1: $4900.0 - Low Jan 23
- SUP 2: $4622.5 - 20-day EMA
- SUP 3: $4536.9 - Low Jan 16
- SUP 4: $4407.6 - 50-day EMA
The primary uptrend in Gold remains intact. The extension higher, confirms a resumption of the uptrend and maintains the price sequence of higher highs and higher lows. The psychological $5000.0 level has been cleared. Sights are on $5167.5 next, a Fibonacci projection. Initial firm support to watch lies at $4622.5 the 20-day EMA. The trend is overbought, a pullback would allow this condition to unwind. First support is at $4900.0, the Jan 23 low.
SILVER TECHS: Clears The $100.00 Psychological Handle
- RES 4: $116.747 - 3.382 proj of the Dec 31 - Jan 7 - 8 price swing
- RES 3: $114.895 - 3.236 proj of the Dec 31 - Jan 7 - 8 price swing
- RES 2: $111.902 - 3.000 proj of the Dec 31 - Jan 7 - 8 price swing
- RES 1: $110.0 - Round number resistance
- PRICE: $109.502 @ 08:33 GMT Jan 26
- SUP 1: $95.700 - Low Jan 23
- SUP 2: $86.015 - 20-day EMA
- SUP 3: $83.437 - Low Jan 13
- SUP 4: $73.443 - 50-day EMA
Trend signals in Silver are unchanged, they remain bullish. Fresh cycle highs last week, and a strong bullish start to this week’s activity, reinforce current bullish conditions. Price has traded through the psychological $100.00 handle. Sights are on the $110.0 handle next and $111.902, a Fibonacci projection. The trend is overbought, a pullback would allow this condition to unwind. Initial firm support lies at $86.015, the 20-day EMA.