MNI DAILY TECHNICAL ANALYSIS - Silver Correction Extends
Price Signal Summary – Silver Correction Extends
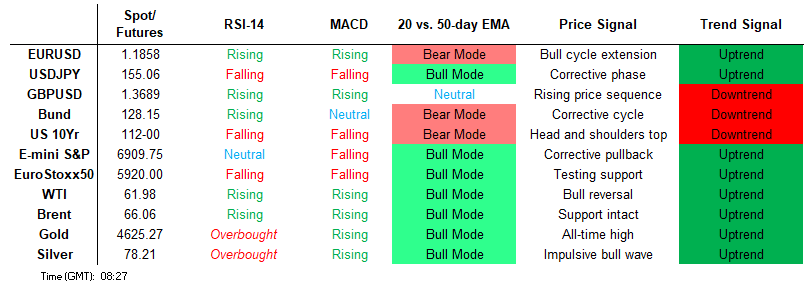
- A bull cycle in EUROSTOXX 50 futures remains intact and S/T weakness is - for now - considered corrective. The next important support to monitor lies at the 50-day EMA at 5851.01. The trend in S&P E-Minis is bullish and the pullback from last week’s high is considered corrective. However, note that a doji candle pattern on Jan 28 and a hammer candle on Jan 29, continues to signal scope for a deeper retracement near-term.
- GBPUSD has pulled back from its recent highs. The move down is considered corrective and a continuation lower would allow a recent overbought condition to unwind. Short-term trend conditions in USDJPY are unchanged and a bear cycle remains intact. However, a corrective cycle is in play and the latest recovery is allowing a recent oversold condition to unwind. A bull cycle in AUDUSD remains in play and last week’s gains reinforce current trend conditions. However, the latest pullback highlights the start of a corrective phase.
- A sharp sell-off in Gold confirms a top in the long-term trend - for now - and from a short-term perspective, marks an unwinding of the recent extreme overbought condition. A bull cycle in WTI futures remains intact. However, today’s strong bearish start to this week’s session highlights the beginning of a corrective phase.
- Despite recent gains, the trend outlook in Bund futures remains bearish - for now - and recent gains are considered corrective. Support at 127.70, the Jan 9 low, has recently been breached. Gilt futures remain in a bear-mode condition. Recent weakness has resulted in a break of the 20-day EMA. Note too that price is trading below 91.26, a trendline support drawn from the Nov 19 low.
[GLOBAL] MNI Tech Trend Monitor - Highlighting Longer-Term Trends:
- Refreshing the MNI Tech Trend Monitor, Adding USDZAR, USDCNH and the e-mini S&P chart, while refreshing levels for Gold, USD/JPY, EUR/GBP, EUR/HUF, USD/MXN, the European Banking Stock Index (SX7E) as well as UK Gilts.
See full document here: https://media.marketnews.com/MNI_Tech_Trend_Monitor_Jan26_cef40b4ef1.pdf
FOREIGN EXCHANGE
EURUSD TECHS: Approaching The 20-Day EMA
- RES 4: 1.2081 High Jan 27 and key resistance
- RES 3: 1.2045 High Jan 28
- RES 2: 1.1975 High Jan 30
- RES 1: 1.1896 Low Jan 28
- PRICE: 1.1846 @ 06:22 GMT Feb 2
- SUP 1: 1.1840 Intraday low
- SUP 2: 1.1793 20-day EMA
- SUP 3: 1.1729 50-day EMA
- SUP 4: 1.1670 Low Jan 22
A sharp reversal in EURUSD from last week’s high confirms the start of a corrective cycle. This also highlights an unwinding of a recent extreme overbought reading in the trend. The move down signals potential for an extension towards 1.1793, the 20- day EMA. Support at the 50-day EMA lies at 1.1729. A breach of the 50-day average would suggest scope for a deeper retracement. Initial firm resistance is at 1.1975, the Jan 30 high.
GBPUSD TECHS: Corrective Cycle
- RES 4: 1.3913 High Sep 14 2021
- RES 3: 1.3889 1.00 proj of the Nov 4 - Jan 6 - Jan 19 price swing
- RES 2: 1.3868 High Jan 27 and the bull trigger
- RES 1: 1.3814 High Jan 30
- PRICE: 1.3666 @ 06:32 GMT Feb 2
- SUP 1: 1.3637 Low Jan 26
- SUP 2: 1.3578 20-day EMA
- SUP 3: 1.3471 25-day EMA
- SUP 4: 1.3402 Low Jan 22
GBPUSD has pulled back from its recent highs. The move down is considered corrective and a continuation lower would allow a recent overbought condition to unwind. The initial firm support to watch is at the 20-day EMA, at 1.3578. Support at the 50-day EMA lies at 1.3471. The medium-term trend theme remains bullish. The bull trigger has been defined at 1.3868, the Jan 27 high.
EURGBP TECHS: Key Support Remains Exposed
- RES 4: 0.8813 76.4% retracement of the Nov 14 - Jan 6 bear leg
- RES 3: 0.8797 High Dec 17
- RES 2: 0.8781 61.8% retracement of the Nov 14 - Jan 6 bear leg
- RES 1: 0.8708/46 50-day EMA / High Dec 31 & Jan 21
- PRICE: 0.8668 @ 07:08 GMT Feb 2
- SUP 1: 0.8644 Low Jan 6 and the bear trigger
- SUP 2: 0.8633 Low Sep 15
- SUP 3: 0.8620 38.2% retracement of the Dec ‘24 - Nov ‘25 bull cycle
- SUP 4: 0.8597 Low Aug 14
EURGBP is trading closer to its recent lows. A bear threat remains intact and recent weakness signals the end of a corrective phase between Jan 6 - 21. MA studies are in a bear-mode set-up and this highlights a dominant bear cycle. Key support and the bear trigger lies at 0.8644, the Jan 6 low. A break of this level would confirm a resumption of the trend and open 0.8620, a Fibonacci retracement. Key resistance is 0.8746, the Jan 21 high.
USDJPY TECHS: Gains Considered Corrective For Now
- RES 4: 159.45 High Jan 14 and the bull trigger
- RES 3: 159.23 High Jan 23
- RES 2: 157.43 Low Jan 23
- RES 1: 155.76 50-day EMA
- PRICE: 154.62 @ 06:54 GMT Feb 2
- SUP 1: 152.10 Low Jan 27 and the bear trigger
- SUP 2: 151.98 38.2% of the Apr 22 ‘25 - Jan 14 bull cycle
- SUP 3: 151.54 Low Oct 29 ‘25
- SUP 4: 150.99 Trendline support drawn from the Apr 22 ‘25 low
Short-term trend conditions in USDJPY are unchanged and a bear cycle remains intact. However, a corrective cycle is in play and the latest recovery is allowing a recent oversold condition to unwind. Firm resistance to watch is at 155.76, the 50-day EMA. A clear break of this average would signal a possible bullish reversal. Key short-term support has been defined at 152.10, the Jan 27 low. A break would resume the recent downtrend.
EURJPY TECHS: Short-Term Bear Threat Still Present
- RES 4: 188.65 3.236 proj of the Oct 17 - Oct 30 - Nov 5 price swing
- RES 3: 188.20 Bull channel top drawn from the Feb 28 ‘25 low
- RES 2: 186.87 High Jan 23 and the bull trigger
- RES 1: 183.87 20-day EMA
- PRICE: 183.46 @ 07:33 GMT Feb 2
- SUP 1: 181.79 Low Jan 26
- SUP 2: 181.57 Low Dec 17
- SUP 3: 180.50 Low Dec 8
- SUP 4: 180.06 Base of a bull channel drawn from the Feb 28 ‘25 low
A short-term corrective bear cycle in EURJPY remains in play - for now. The cross has recently pierced support around the 50-day EMA, currently at 182.67. A clear breach of the average would highlight a stronger reversal and open 181.57 next, the Dec 17 low. For bulls, a resumption of gains would refocus attention on the bull trigger, at 186.87, the Jan 23 high. Clearance of this hurdle would confirm a resumption of the primary uptrend.
AUDUSD TECHS: Off Last Week’s Trend High
- RES 4: 0.7208 61.8% of the Feb 25 ‘21 - Apr 9 ‘25 bear leg
- RES 3: 0.7158 High Feb 2 2023
- RES 2: 0.7123 2.000 proj of the Nov 21 - Dec 10 - 18 price swing
- RES 1: 0.7094 High Jan 29 ,and the bull trigger
- PRICE: 0.6940 @ 08:01 GMT Feb 2
- SUP 1: 0.6909 Intraday low
- SUP 2: 0.6835 20-day EMA
- SUP 3: 0.6727 50-day EMA
- SUP 4: 0.6660 Low Dec 31
A bull cycle in AUDUSD remains in play and last week’s gains reinforce current trend conditions. However, the latest pullback highlights the start of a corrective phase. If correct, it suggests potential for an extension towards support around the 20-day EMA, at 0.6835. This would also confirm an unwinding of the recent overbought trend condition. Key short-term resistance and the bull trigger has been defined at 0.7094, the Jan 29 high.
USDCAD TECHS: Resistance Remains Intact For Now
- RES 4: 1.3929 High Jan 16 and a reversal trigger
- RES 3: 1.3879 High Jan 20
- RES 2: 1.3799 50-day EMA
- RES 1: 1.3727 20-day EMA
- PRICE: 1.3643 @ 08:11 GMT Feb 2
- SUP 1: 1.3482 Low Jan 30 and the bear trigger
- SUP 2: 1.3473 Low Oct 2 ‘24
- SUP 3: 1.3400 50.0% retracement of the 2021 - 2025 uptrend
- SUP 4: 1.3359 Low Jan 31 2024
A bearish theme in USDCAD remains intact following recent weakness and the recovery from Friday’s low is for now, considered corrective. Note that the trend has been in oversold territory and the bounce is allowing this condition to unwind. The next important resistance to watch is 1.3727, the 20-day EMA. Resistance at the 50-day EMA, is at 1.3799. Key support and the bear trigger lies at 1.3482, last Friday’s low.
FIXED INCOME
BUND TECHS: (H6) Monitoring Resistance
- RES 4: 129.24 High Dec 1
- RES 3: 128.89 61.8% retracement of the Nov 26 - Dec 22 bear leg
- RES 2: 128.75 High Dec 3
- RES 1: 128.40/58 High Jan 29 / 19 and key short-term resistance
- PRICE: 128.34 @ 05:58 GMT Feb 2
- SUP 1: 127.51 Low Jan 23
- SUP 2: 127.13/126.75 Low Jan 6 / Low Dec 22 and the bear trigger
- SUP 3: 126.53 Low Mar 11 (cont.) and a key support
- SUP 4: 126.35 3.236 projection of the Nov 12 - 20 - 26 price swing
Despite recent gains, the trend outlook in Bund futures remains bearish - for now - and recent gains are considered corrective. Support at 127.70, the Jan 9 low, has recently been breached. The clear break of it strengthens a bear threat and opens 127.13 next, the Jan 6 low. Key short-term resistance to watch is 128.58, the Jan 19 high. For bulls, a breach of 128.58 would reinstate the recent uptrend.
BOBL TECHS: (H6) Corrective Cycle Still In Play
- RES 4: 116.960 High Dec 1
- RES 3: 116.805 76.4% retracement of the Nov 26 - Dec 10 bear leg
- RES 2: 116.720 High Dec 4
- RES 1: 116.690 Intraday high
- PRICE: 116.660 @ 06:09 GMT Feb 2
- SUP 1: 116.402/140 20-day EMA / Low Jan 23
- SUP 2: 115.920 Low Jan 5
- SUP 3: 115.780 Low Dec 22
- SUP 4: 115.720 Low Dec 10 and the bear trigger
The rally last in Bobl futures resulted in a print above a key short-term resistance at 116.640, the Jan 19 high. This suggests the current corrective phase remains intact for now. A continuation higher would signal scope for an extension towards 116.805, a Fibonacci retracement point. Key short-term support has been defined at 116.140, the Jan 23 low. A reversal lower and a break of this level would reinstate a bear cycle.
SCHATZ TECHS: (H6) Resistance Remains Intact For Now
- RES 4: 107.000 Round number resistance
- RES 3: 106.959 76.4% retracement of the Nov 21 - Dec 10 bear leg
- RES 2: 106.945 High Dec 3
- RES 1: 106.935 High Jan 21 / 29 and the bull trigger
- PRICE: 106.895 @ 06:15 GMT Jan 30
- SUP 1: 106.845/760 20-day EMA / Low Jan 23
- SUP 2: 106.725 Low Jan 5
- SUP 3: 106.690 Low Dec 18 & 22
- SUP 4: 106.630 Low Dec 10 and the bear trigger
A dominant bear theme in Schatz futures remains intact and the recent bull cycle between Dec 10 - Jan 21 is considered corrective. A key short-term support at 106.790, the Jan 9, 16 and 22 low, has recently been breached and this signals the end of the corrective phase. A resumption of weakness would open 106.725, the Jan 5 low. Key short-term resistance and the bull trigger to watch has been defined at 106.935, the Jan 21 and 29 high.
GILT TECHS: (H6) Bearish Cycle
- RES 4: 92.95 High Jan and a key resistance
- RES 3: 92.51 High Jan 19
- RES 2: 92.13 High Jan 22
- RES 1: 91.43 20-day EMA
- PRICE: 90.99 @ 08:05 GMT Feb 2
- SUP 1: 90.48 Low Jan 29
- SUP 2: 90.00 Round number support
- SUP 3: 89.86 Low Nov 19 2025 and a key support
- SUP 4: 89.52 1.500 proj of the Jan 14 - 20 - 22 price swing
Gilt futures remain in a bear-mode condition. Recent weakness has resulted in a break of the 20-day EMA. Note too that price is trading below 91.26, a trendline support drawn from the Nov 19 low. The breach of the trendline undermines the recent bull theme and highlights potential for a deeper retracement with sights on the 90.00 handle next. Initial resistance is at 91.43, the 20-day EMA.
BTP TECHS: (H6) Bullish Structure
- RES 4: 121.87 2.000 proj of the Dec 10 - 17 - 22 price swing
- RES 3: 121.58 1.764 proj of the Dec 10 - 17 - 22 price swing
- RES 2: 121.37 High Nov 13
- RES 1: 121.31 High Jan 30
- PRICE: 121.05 @ 07:13 GMT Feb 2
- SUP 1: 120.35 Trendline drawn from the Dec 10 low
- SUP 2: 119.45 Low Dec 22
- SUP 3: 119.13 Low Dec 10 and the bear trigger
- SUP 4: 118.00 Round number support
A bullish theme in BTP futures remains intact and recent weakness has been a correction. Attention on 121.37, the Nov 13 high. Clearance of this hurdle would strengthen the bullish theme. A reversal lower would instead pave the way for a move towards 120.35, a short-term trendline support drawn from the Dec 10 low. Clearance of this trendline would undermine the bull theme and signal scope for a deeper retracement.
EQUITIES
EUROSTOXX50 TECHS: (H6) Monitoring Support At The 50-Day EMA
- RES 4: 6134.00 1.382 proj of the Nov 21 - Dec 12 - 18 price swing
- RES 3: 6100.00 Round number resistance
- RES 2: 6086.99 1.236 proj of the Nov 21 - Dec 12 - 18 price swing
- RES 1: 5986.00/6072.00 High Jan 29 / High Jan 14/15 and bull trigger
- PRICE: 5886.00 @ 06:27 GMT Feb 2
- SUP 1: 5851.01 50-day EMA
- SUP 2: 5838.00 Low Jan 20 and a bear trigger
- SUP 3: 5750.00 Low Dec 23
- SUP 4: 5689.00 Low Dec 18
A bull cycle in EUROSTOXX 50 futures remains intact and S/T weakness is - for now - considered corrective. The next important support to monitor lies at the 50-day EMA at 5851.01. A clear breach of this average would signal scope for a deeper retracement. Moving average studies are in a bull-mode position, highlighting a dominant uptrend. A resumption of gains would open the key resistance and bull trigger at 6072.00, the Jan 14 / 15 high.
E-MINI S&P: (H6) Candle Patterns Highlight A Short-Term Bear Cycle
- RES 4: 7141.7 1.236 proj of the Dec 18 - Jan 13 - 21 price swing
- RES 3: 7100.00 Round number resistance
- RES 2: 7080.92 0.764 proj of the Nov 21 - Dec 11 - 18 price swing
- RES 1: 6960.05/7043.00 20-day EMA / High Jan 28 and bull trigger
- PRICE: 6878.50 @ 07:06 GMT Feb 2
- SUP 1: 6864.50 Intraday low
- SUP 2: 6814.50 Low Jan 21 and the bear trigger
- SUP 3: 6771.50 Low Dec 18 and a key support
- SUP 4: 6684.50 Low Nov 24
The trend in S&P E-Minis is bullish and the pullback from last week’s high is considered corrective. However, note that a doji candle pattern on Jan 28 and a hammer candle on Jan 29, continues to signal scope for a deeper retracement near-term. Today’s move down reinforces the importance of these two patterns. A continuation lower would expose key S/T support at 6814.50, the Jan 21 low. The bull trigger is at 7043.00, the Jan 28 high.
COMMODITIES
BRENT TECHS: (J6) Corrective Phase
- RES 4: $75.93 - 2.00 proj of the Jan 5 - 14 - 19 price swing
- RES 3: $73.33 - High Jun 23 ‘25 and a key M/T resistance
- RES 2: $72.00 - Round number resistance
- RES 1: $68.83/70.58 - Intraday high / High Jan 29 and the bull trigger
- PRICE: $65.76 @ 06:55 GMT Feb 2
- SUP 1: $64.86 - 20-day EMA
- SUP 2: $63.44 - 50-day EMA
- SUP 3: $62.59 - Low Jan 19
- SUP 4: $59.44 - Low Jan 5
A bull theme in Brent futures remains intact, however, the sharp reversal from last week’s high highlights - for now - the start of a corrective cycle. Support to watch lies at $64.86, the 20-day EMA. Support the 50-day EMA, is at $63.44. The area between the two averages represents a key support zone. A clear breach of the 50-day average would signal scope for a deeper retracement. Key resistance has been defined at $70.58, the Jan 29 high.
WTI TECHS: (H6) Bearish Start To The Week
- RES 4: $71.66 - 2.00 proj of the Jan 7 - 14 - 20 price swing
- RES 3: $69.80 - High Jun 23 ‘25 and a key medium-term resistance
- RES 2: $68.00 - Round number resistance
- RES 1: $66.48 - High Jan 30
- PRICE: $62.19 @ 07:16 GMT Feb 2
- SUP 1: $60.8959.64 - 20- and 50-day EMA values
- SUP 2: $58.53 - Low Jan 20
- SUP 3: $55.65 - Low Ja 7
- SUP 4: $54.56 - Low Apr 9 ‘25 and a key support
A bull cycle in WTI futures remains intact. However, today’s strong bearish start to this week’s session highlights the beginning of a corrective phase. Attention is on support at the 20-day EMA, at $60.89. The 50-day EMA lies at $59.64. A clear breach of the 50-day average would highlight a stronger reversal and open $58.53, the Jan 20 low. Key resistance and the bull trigger has been defined at $66.48, the Jan 30 high.
GOLD TECHS: Unwinding An Extreme Overbought Condition
- RES 4: $5106.2 - Low Jan 29
- RES 3: $5000.0 - Round number resistance
- RES 2: $4885.0 - Intraday high
- RES 1: $4690.0- Low Jan 30
- PRICE: $4546.6 @ 06:00 GMT Feb 2
- SUP 1: $4499.5 - Intraday low
- SUP 2: $4407.9 - Low Jan 8
- SUP 3: $4274.7 - Low Dec 31 ‘25 and a key support
- SUP 4: $4170.3 - Low Dec 9
A sharp sell-off in Gold confirms a top in the long-term trend - for now - and from a short-term perspective, marks an unwinding of the recent extreme overbought condition. The metal has traded through the 20-day EMA, and has pierced the 50-day EMA, at $4546.7. A break of this average would signal scope for a deeper retracement and open $4274.7, the Dec 31 ‘25 low. Initial firm resistance is at 4885.1, today’s intraday high so far.
SILVER TECHS: Reversal Confirms A Top
- RES 4: $121.654 - High Jan 30 and key resistance
- RES 3: $106.895 - Low Jan 29
- RES 2: $100.000 - Round number resistance
- RES 1: $93.860 - 20-day EMA
- PRICE: $79.849 @ 06:11 GMT Feb 2
- SUP 1: $72.794 - Intraday low
- SUP 2: $70.071 - Low Dec 31
- SUP 3: $64.493 - Low Dec 19
- SUP 4: $60.815 - Low Dec 12
The strong reversal in Silver confirms a top in the long-term trend - for now - and from a short-term perspective, highlights an unwinding of the recent extreme overbought condition. The metal has traded through both the 20- and 50-day EMAs. This signals scope for a deeper retracement and opens $70.071, the Dec 31 ‘25 low. Initial firm resistance is at 93.860, the 20-day EMA.