MNI DAILY TECHNICAL ANALYSIS - Primary AUD Bull Cycle In Play
Price Signal Summary - Primary AUD Bull Cycle In Play
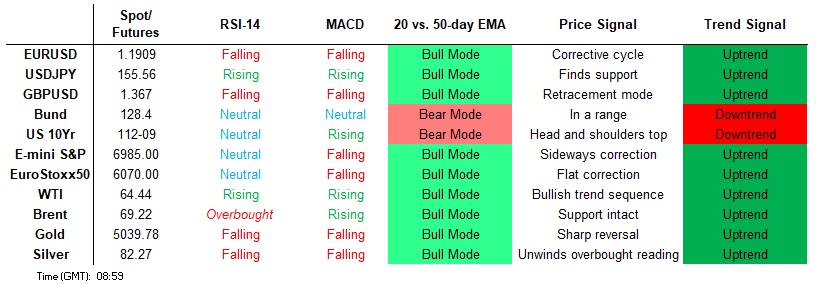
- A short-term bearish theme in S&P E-Minis resulted in a break last week of 6814.50, the Jan 21 low and a bear trigger. This proved short-lived, however, with prices rising swiftly back above to begin this week. The medium-term trend condition in EUROSTOXX 50 futures remains bullish and the latest pullback through the 50-day EMA appears corrective. A clear break below this average would undermine the bull theme.
- The softer USD theme worked in favour of AUDUSD bulls Monday, with the intraday high at 0.7099 showing briefly through the bull trigger. This keeps the primary bull cycle in play. USDCAD price faded Monday in response to the generally softer USD theme, and that momentum has spilled over into Tuesday trade. Market focus is on whether the recovery from the Jan 30 low has now concluded and the broader downside theme can resume. Monday’s price action provides good evidence that the bearish correction in EURUSD has concluded, with the impulsive rally through 1.1900 marking a ~150 pip rally off Friday’s lows.
- The latest bounce in Gold highlights a retracement of the Jan 29 - Feb 2 sell-off. The next two resistance points to monitor are $5139.9 and $5314.0, Fibonacci retracement levels. A bull cycle in WTI futures remains intact. However, the reversal from the Jan 29 high continues to highlight a corrective cycle. Attention is on support at the 20-day EMA, at $62.16.
- The medium-term trend condition in Bund futures remains bearish, however, note that resistance at 128.58, the Jan 19 high and key short-term resistance, was tested last week. The short-term outlook in Gilt futures worsened Monday, with a show through key support of 89.86, the Nov 19 2025 low. This strengthens a bear theme and confirms a resumption of the current downtrend.
[GLOBAL] MNI Tech Trend Monitor - Highlighting Longer-Term Trends:
- Refreshing the MNI Tech Trend Monitor, Adding USDZAR, USDCNH and the e-mini S&P chart, while refreshing levels for Gold, USD/JPY, EUR/GBP, EUR/HUF, USD/MXN, the European Banking Stock Index (SX7E) as well as UK Gilts.
See full document here: https://media.marketnews.com/MNI_Tech_Trend_Monitor_Jan26_cef40b4ef1.pdf
FOREIGN EXCHANGE
EURUSD TECHS: Impulsive Rally
- RES 4: 1.2081 High Jan 27 and key resistance
- RES 3: 1.2045 High Jan 28
- RES 2: 1.1975 High Jan 30
- RES 1: 1.1927 High Feb 09
- PRICE: 1.1907 @ 08:19 GMT Feb 10
- SUP 1: 1.1766 Low Feb 06
- SUP 2: 1.1749 50-day EMA
- SUP 3: 1.1693 76.4% retracement of the Jan 19 -0 27 bull leg
- SUP 4: 1.1670 Low Jan 22
Monday’s price action provides good evidence that the bearish correction in EURUSD has concluded, with the impulsive rally through 1.1900 marking a ~150 pip rally off Friday’s lows. This shifts focus to the scale of the recovery, with 1.1975 the next notable resistance into 1.20 and the cycle highs of 1.2081. Support to watch remains the 50-day EMA, at 1.1749. A clear breach of this 50-day average would suggest scope for a deeper pullback.
GBPUSD TECHS: Rally Opens Gap with Support
- RES 4: 1.3889 1.00 proj of the Nov 4 - Jan 6 - Jan 19 price swing
- RES 3: 1.3868 High Jan 27 and the bull trigger
- RES 2: 1.3733/3814 High Feb 4 / high Jan 30
- RES 1: 1.3688 High Feb 09
- PRICE: 1.3668 @ 08:14 GMT Feb 10
- SUP 1: 1.3509 Low Feb 6
- SUP 2: 1.3507 50-day EMA
- SUP 3: 1.3458 76.4% retracement of the Jan 19 - 27 upleg
- SUP 4: 1.3402 Low Jan 22
Price rallied well Monday, adding to the bounce off last week’s lows. This may signal the end of the bearish corrective cycle posted off the YTD highs and is infitting with the trend in moving averages, which continues to point higher for now. Markets need to confirm a close back above layered support between 1.3733-1.3814, which would help open the bull trigger of 1.3868. The next key support to watch remains the 50-day EMA, at 1.3507.
EURGBP TECHS: Key Resistance Holding For Now
- RES 4: 0.8797 High Dec 17
- RES 3: 0.8746 High Jan 21 and a key resistance
- RES 2: 0.8741 High Feb 09
- RES 1: 0.8729 100-dma
- PRICE: 0.8710 @ 08:13 GMT Feb 10
- SUP 1: 0.8678/8613 20-day EMA / Low Feb 04 and bear trigger
- SUP 2: 0.8597 Low Aug 14
- SUP 3: 0.8578 Low Jul 2 ‘25
- SUP 4: 0.8544 50.0% retracement of the Dec ‘24 - Nov ‘25 bull cycle
Thursday’s strong bounce in EURGBP, and the continuation Monday, still appears corrective. Key short-term resistance to monitor is 0.8746, the Jan 21 high, where a break would signal a potential trend reversal. Moving average studies are in a bear-mode position and this highlights a dominant downtrend. A resumption of weakness would open 0.8597, the Aug 14 low. The bear trigger is at 0.8613, the Feb 4 low.
USDJPY TECHS: Election Outcome Boosts JPY
- RES 4: 159.45 High Jan 14 and the bull trigger
- RES 3: 159.23 High Jan 23
- RES 2: 157.76 High Feb 09
- RES 1: 157.72 76.4% retracement of the Jan 14 - 27 bear leg
- PRICE: 155.52 @ 08:20 GMT Feb 10
- SUP 1: 154.52 100-dma
- SUP 2: 154.55/152.10 Low Feb 2 / Low Jan 27 and the bear trigger
- SUP 3: 151.98 38.2% of the Apr 22 ‘25 - Jan 14 bull cycle
- SUP 4: 151.44 Trendline support drawn from the Apr 22 ‘25 low
Despite an early rally Monday, prices have settled markedly lower as the digestion of the election outcome looks a net positive for JPY. With prices lower on the week, USDJPY is cleanly through the 50-dma, and may signal an extension of any downtrend. For now, the medium-term bull cycle remains in play. Sights are on 157.72, a Fibonacci retracement point. Clearance of this level would strengthen the bull theme.
EURJPY TECHS: Short-Term Bull Cycle Still In Play
- RES 4: 188.62 Bull channel top drawn from the Feb 28 ‘25 low
- RES 3: 187.71 3.000 proj of the Oct 17 - Oct 30 - Nov 5 price swing
- RES 2: 186.87 High Jan 23 and the bull trigger
- RES 1: 186.36 High Feb 9
- PRICE: 185.21 @ 08:23 GMT Feb 10
- SUP 1: 181.79 Low Jan 26
- SUP 2: 181.57 Low Dec 17
- SUP 3: 180.48 Base of a bull channel drawn from the Feb 28 ‘25 low
- SUP 4: 179.77 Low Nov 21
EURJPY is holding on to its latest gains and a short-term bull cycle remains in play - for now. A continuation higher would suggest the end of the recent corrective pullback and expose 186.87, the Jan 23 high and the bull trigger. Clearance of this hurdle would confirm a resumption of the uptrend. Support to watch lies at 181.79, the Jan 26 low. A reversal through this support would expose 180.48, a bull channel support drawn from the Feb 28 ‘25 low.
AUDUSD TECHS: Testing Bull Trigger
- RES 4: 0.7208 61.8% of the Feb 25 ‘21 - Apr 9 ‘25 bear leg
- RES 3: 0.7158 High Feb 2 2023
- RES 2: 0.7123 2.000 proj of the Nov 21 - Dec 10 - 18 price swing
- RES 1: 0.7099 High Feb 9
- PRICE: 0.7073 @ 08:30 GMT Feb 10
- SUP 1: 0.6912 20-day EMA
- SUP 2: 0.6834 Low Jan 23
- SUP 3: 0.6785 50-day EMA
- SUP 4: 0.6660 Low Dec 31
The softer USD theme worked in favour of bulls Monday, with the intraday high at 0.7099 showing briefly through the bull trigger. This keeps the primary bull cycle in play. The pullback that started Jan 29 marked a corrective phase, and the failure to break below the 20-day EMA contained any further extension lower. As such, the pullback helped confirm an unwinding of the overbought trend condition. Any weakness here looks for a break of the 20-day average, which would expose 0.6785, the 50-day EMA.
USDCAD TECHS: Fades Fast Off Resistance
- RES 4: 1.3929 High Jan 16 and a reversal trigger
- RES 3: 1.3879 High Jan 20
- RES 2: 1.3768 50-day EMA
- RES 1: 1.3725 High Feb 02
- PRICE: 1.3563 @ 08:32 GMT Feb 10
- SUP 1: 1.3548/3482 Low Feb 10 / Low Jan 30 and the bear trigger
- SUP 2: 1.3473 Low Oct 2 ‘24
- SUP 3: 1.3400 50.0% retracement of the 2021 - 2025 uptrend
- SUP 4: 1.3359 Low Jan 31 2024
USDCAD price faded Monday in response to the generally softer USD theme, and that momentum has spilled over into Tuesday trade. Market focus is on whether the recovery from the Jan 30 low has now concluded and the broader downside theme can resume. The trend had been oversold, and the recent bounce has allowed this condition to fully unwind - making for a more attractive entry point for shorts. Key support and the bear trigger lies at 1.3482, the Jan 30 low. Resistance to watch is 1.3693, the 20-day EMA.
FIXED INCOME
BUND TECHS: (H6) Monitoring Resistance
- RES 4: 129.24 High Dec 1
- RES 3: 128.89 61.8% retracement of the Nov 26 - Dec 22 bear leg
- RES 2: 128.75 High Dec 3
- RES 1: 128.58 High Jan 19 and key short-term resistance
- PRICE: 128.39 @ 07:36 GMT Feb 10
- SUP 1: 128.00/51 20-day EMA / Low Jan 23
- SUP 2: 127.13/126.75 Low Jan 6 / Low Dec 22 and the bear trigger
- SUP 3: 126.53 Low Mar 11 (cont.) and a key support
- SUP 4: 126.35 3.236 projection of the Nov 12 - 20 - 26 price swing
The medium-term trend condition in Bund futures remains bearish, however, note that resistance at 128.58, the Jan 19 high and key short-term resistance, was tested last week. A break of this level would undermine the bear theme and highlight a bullish break. This would open 128.89, a Fibonacci retracement point. Support to watch lies at 127.51, the Jan 23 low. Clearance of this level would signal a resumption of the downtrend and open 127.13, the Jan 6 low.
BOBL TECHS: (H6) Bull Cycle Still In Play
- RES 4: 117.140 High Nov 26 ‘25 and a key resistance
- RES 3: 117.020 High Nov 28 ‘25
- RES 2: 116.960 High Dec 1
- RES 1: 116.810 High Feb 6
- PRICE: 116.720 @ 07:38 GMT Feb 10
- SUP 1: 116.472 20-day EMA
- SUP 2: 116.290/140 Low Feb 3 and key S/T support / Low Jan 23
- SUP 3: 115.920 Low Jan 5
- SUP 4: 115.780 Low Dec 22
An underlying bullish cycle in Bobl futures is intact. Short-term pullbacks still appear corrective, although longer-term trend signals remain bearish. The contract has pierced 116.805, the 76.4% retracement of the Nov 26 - Dec 10 bear leg. A clear break of this level would pave the way for a climb towards 116.960, the Dec 1 high. Initial support to watch lies at 116.290, the Feb 3 low. Clearance of this level would signal a reversal.
SCHATZ TECHS: (H6) Short-Term Bull Cycle Remains In Play
- RES 4: 107.030 High Nov 26
- RES 3: 107.000 Round number resistance
- RES 2: 106.959 76.4% retracement of the Nov 21 - Dec 10 bear leg
- RES 1: 106.955 High Feb 6
- PRICE: 106.890 @ 07:40 GMT Feb 10
- SUP 1: 106.815 Low Feb 3 and a key short-term support
- SUP 2: 106.760 Low Jan 23
- SUP 3: 106.725 Low Jan 5
- SUP 4: 106.690 Low Dec 18 & 22
Schatz futures pierced resistance at 106.935, the Jan 21 / 29 high last week and the bull trigger. A clear break of this hurdle would undermine the medium-term bearish theme and signal scope for a stronger recovery, potentially through 106.959, the 76.4% retracement of the Nov 21 - Dec 10 bear leg. Support to watch remains at 106.815, the Feb 3 low. A move lower and a breach of this support would highlight a potential bear reversal.
GILT TECHS: (H6) Through Key Support
- RES 4: 92.95 High Jan and a key resistance
- RES 3: 92.51 High Jan 19
- RES 2: 92.13 High Jan 22
- RES 1: 91.09 20-day EMA
- PRICE: 90.51 @ Feb 09 Close
- SUP 1: 89.76 Low Feb 6
- SUP 2: 89.73 1.382 proj of the Jan 14 - 20 - 22 price swing
- SUP 3: 89.52 1.500 proj of the Jan 14 - 20 - 22 price swing
- SUP 4: 89.06 1.764 proj of the Jan 14 - 20 - 22 price swing
The short-term outlook in Gilt futures worsened Monday, with a show through key support of 89.86, the Nov 19 2025 low. This strengthens a bear theme and confirms a resumption of the current downtrend. The break lower resulted in a move through the 90.00 handle. Attention is on the next key support at 89.73, the 1.382 projection of the Jan 14 - 20 - 22 price swing. Clearance of this level would further strengthen the current downtrend. Initial key resistance is at 91.09, the 20-day EMA.
BTP TECHS: (H6) Trend Set-Up Remains Bullish
- RES 4: 122.32 1.0% 10-dma envelope
- RES 3: 121.87 2.000 proj of the Dec 10 - 17 - 22 price swing
- RES 2: 121.58 1.764 proj of the Dec 10 - 17 - 22 price swing
- RES 1: 121.43 High Feb 10
- PRICE: 121.35 @ 07:48 GMT Feb 10
- SUP 1: 120.90 Trendline drawn from the Dec 10 low
- SUP 2: 119.45 Low Dec 22
- SUP 3: 119.13 Low Dec 10 and the bear trigger
- SUP 4: 118.00 Round number support
A bullish theme in BTP futures remains intact and short-term pullbacks appear to have been corrective. Resistance at 121.37, the Nov 13 high, has been cleared. This strengthens the bullish theme, with resistance layered above at 121.58-87. On the downside, a reversal lower would expose 120.90, a short-term trendline support drawn from the Dec 10 low. Clearance of this trendline would be bearish and undermine the bull theme plus signal scope for a deeper retracement.
EQUITIES
EUROSTOXX50 TECHS: (H6) Pierces Support At The 50-Day EMA
- RES 4: 6134.00 1.382 proj of the Nov 21 - Dec 12 - 18 price swing
- RES 3: 6100.00 Round number resistance
- RES 2: 6086.00 High Feb 3 and the bull trigger
- RES 1: 6077.00 High Feb 10
- PRICE: 6075.00 @ 07:56 GMT Feb 10
- SUP 1: 5883.54/5865.00 50-day EMA / Low Feb 06
- SUP 2: 5838.00 Low Jan 20 and a bear trigger
- SUP 3: 5750.00 Low Dec 23
- SUP 4: 5689.00 Low Dec 18
The medium-term trend condition in EUROSTOXX 50 futures remains bullish and the latest pullback through the 50-day EMA appears corrective. A clear break below this average would undermine the bull theme and signal scope for a deeper retracement. The bull trigger is at 6086.00, the Jan 3 high. A move through this hurdle would resume the primary uptrend.
E-MINI S&P: (H6) Edges Above Resistance
- RES 4: 7080.92 0.764 proj of the Nov 21 - Dec 11 - 18 price swing
- RES 3: 7061.44 2.0% Upper Bollinger Band
- RES 2: 7043.00 High Jan 28 and bull trigger
- RES 1: 7025.43 1.0% 10-dma envelope
- PRICE: 6985.00 @ 08:10 GMT Feb 10
- SUP 1: 6948.26 20-day EMA
- SUP 2: 6733.00 Low Nov 25 ‘25
- SUP 3: 6691.56 76.4% retracement of the Nov 21 - Jan 28 bull leg
- SUP 4: 6583.00 Low Nov 211 and a key medium-term support
A short-term bearish theme in S&P E-Minis resulted in a break last week of 6814.50, the Jan 21 low and a bear trigger. This proved short-lived, however, with prices rising swiftly back above to begin this week. Note this puts the contract back above the 20- and 50-day EMAs. Any continuation lower would open 6691.56, a Fibonacci retracement point. The contract has recovered today. Initial firm resistance now is 7025.43, the 1.0% 10-dma envelope. A break of this hurdle would be bullish.
COMMODITIES
BRENT TECHS: (J6) Corrective Phase In Play
- RES 4: $75.93 - 2.00 proj of the Jan 5 - 14 - 19 price swing
- RES 3: $73.33 - High Jun 23 ‘25 and a key M/T resistance
- RES 2: $72.00 - Round number resistance
- RES 1: $70.58 - High Jan 29 and the bull trigger
- PRICE: $69.01 @ 08:36 GMT Feb 10
- SUP 1: $66.31 - 20-day EMA
- SUP 2: $64.41 - 50-day EMA
- SUP 3: $62.59 - Low Jan 19
- SUP 4: $59.44 - Low Jan 5
A bull theme in Brent futures remains intact, however, note that the sharp reversal from the Jan 29 high highlights - for now - a corrective cycle. Support to watch lies at $66.31, the 20-day EMA. Support the 50-day EMA, is at $64.41. The area between these two averages represents a key support zone. A clear breach of the 50-day average would signal scope for a deeper retracement. Key resistance and the bull trigger is $70.58, the Jan 29 high.
WTI TECHS: (H6) Support Remains Intact For Now
- RES 4: $71.66 - 2.00 proj of the Jan 7 - 14 - 20 price swing
- RES 3: $69.80 - High Jun 23 ‘25 and a key medium-term resistance
- RES 2: $68.00 - Round number resistance
- RES 1: $66.48 - High Jan 30
- PRICE: $64.19 @ 08:49 GMT Feb 10
- SUP 1: $62.16/60.50 - 20- and 50-day EMA values
- SUP 2: $58.53 - Low Jan 20
- SUP 3: $55.65 - Low Jan 7
- SUP 4: $54.56 - Low Apr 9 ‘25 and a key support
A bull cycle in WTI futures remains intact. However, the reversal from the Jan 29 high continues to highlight a corrective cycle. Attention is on support at the 20-day EMA, at $62.16. The 50-day EMA lies at $60.50. A clear breach of the 50-day average would highlight a stronger reversal and open $58.53, the Jan 20 low. Key resistance and the bull trigger has been defined at $66.48, the Jan 30 high.
GOLD TECHS: Retracement Mode
- RES 4: $5451.0 - High Jan 30
- RES 3: $5314.0 - 76.4% retracement of the Jan 29 - Feb 2 pullback
- RES 2: $5139.9 - 61.8% retracement of the Jan 29 - Feb 2 pullback
- RES 1: $5091.6 - High Feb 4
- PRICE: $5031.1 @ 08:51 GMT Feb 10
- SUP 1: $4661.0 - Low Feb 3
- SUP 2: $4403.0 - Low Feb 2 and the bear trigger
- SUP 3: $4274.7 - Low Dec 31 ‘25 and a key support
- SUP 4: $4170.3 - Low Dec 9
The latest bounce in Gold highlights a retracement of the Jan 29 - Feb 2 sell-off. The next two resistance points to monitor are $5139.9 and $5314.0, Fibonacci retracement levels. Note that the sharp sell-off from the Jan 29 high highlights a potential top in the L/T trend and from a S/T perspective, an unwinding of the recent extreme overbought condition. A resumption of bearish activity would refocus attention on $4403.0, the Feb 2 low.
SILVER TECHS: Stabilising
- RES 4: $121.654 - High Jan 30 and key resistance
- RES 3: $106.895 - Low Jan 29
- RES 2: $100.000 - Round number resistance
- RES 1: $87.896 - 20-day EMA
- PRICE: $82.346 @ 08:52 GMT Feb 10
- SUP 1: $64.098 - Low Feb 6
- SUP 2: $61.136 - 0.618 proj of the Jan 29 - Feb 2 - 4 price swing
- SUP 3: $53.797 - 0.618 proj of the Jan 29 - Feb 2 - 4 price swing
- SUP 4: $50.00 - Former key resistance area and major support
A sharp sell-off in Silver last week confirms a resumption of the bear leg that started on Jan 29. Note the move lower highlights an unwinding of the recent extreme overbought condition. The metal has traded through both the 20- and 50-day EMAs, signalling scope for a deeper retracement. Sights are on $61.136 next, a Fibonacci projection. Initial firm resistance is at 87.896, the 20-day EMA.