MNI DAILY TECHNICAL ANALYSIS - Brent Bull Wave Intact
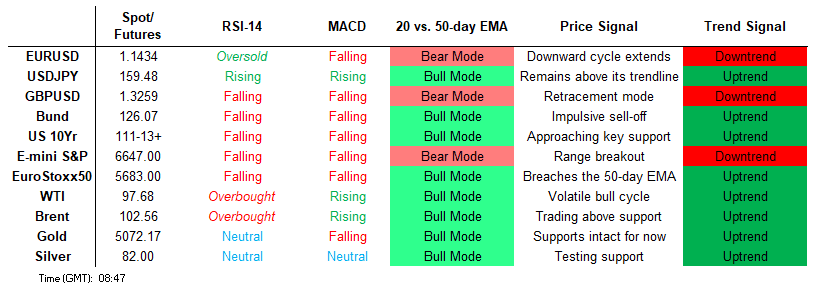
Price Signal Summary - Brent Bull Wave Intact
- A sharp bounce in S&P E-Minis on Monday and the reversal from Tuesday’s high highlights the fact that recent gains were most likely corrective. This has allowed a recent oversold trend condition to unwind. The sharp rebound in EUROSTOXX 50 futures from Monday’s low is for now, considered corrective and this is allowing an extreme oversold trend condition to unwind.
- The pullback from Tuesday’s high in GBPUSD signals the end of the recent corrective bounce. This leaves resistance at the 50-day EMA, at 1.3482, intact. USDJPY has traded to a fresh short-term cycle high. The pair has pierced key short-term resistance at 159.45, the Jan 14 high, and this break confirms a resumption of the bull cycle that started Apr 22 last year. AUDUSD has pulled back from Wednesday’s high. For now, the move down is considered corrective and attention turns to key support at 6963.00, the 50-day EMA.
- A volatile bull wave in Brent futures remains intact - for now. The sharp pullback from Monday’s high has allowed a recent extreme overbought trend condition to unwind. Gold remains in consolidation mode and is trading below $5419.11, the Mar 2 high. A short-term bullish theme is intact following recent gains. The metal has cleared all key retracement points of the sharp sell-off between Jan 29 - Feb 2.
- A bear cycle in Bund futures remains intact and today’s fresh cycle low reinforces current conditions. The contract has traded through a key support at 125.90, the Dec 22 low. A volatile bear cycle in Gilt futures remains intact. The breach of support at 88.80 the Mar 9 low, confirms a resumption of the downtrend and maintains the current bearish sequence of lower lows and lower highs.
[GLOBAL] MNI Tech Trend Monitor - Highlighting Longer-Term Trends:
- Refreshing the MNI Tech Trend Monitor, Adding USDZAR, USDCNH and the e-mini S&P chart, while refreshing levels for Gold, USD/JPY, EUR/GBP, EUR/HUF, USD/MXN, the European Banking Stock Index (SX7E) as well as UK Gilts.
See full document here: https://media.marketnews.com/MNI_Tech_Trend_Monitor_Jan26_cef40b4ef1.pdf
[USD] Risk Reversal Rally May Mean Next USD Rally on Stronger Footing:
- The USD Index has so far failed to maintain gains above the January high: the index has pierced, but failed to build above, 99.492 on several occasions now. However, future rallies could be built on stronger footing given the sharp rise in demand for USD upside insurance on the latest leg.
- A synthetic USD risk reversal has rallied sharply through the Iran war, rising to the highest levels since 2022. Maintenance of these levels would put options market positioning on a par with periods associated with a structurally much stronger dollar:
Figure 1: A synthetic USD risk reversal is fast approaching multi-year highs, despite the moderation in the greenback rally
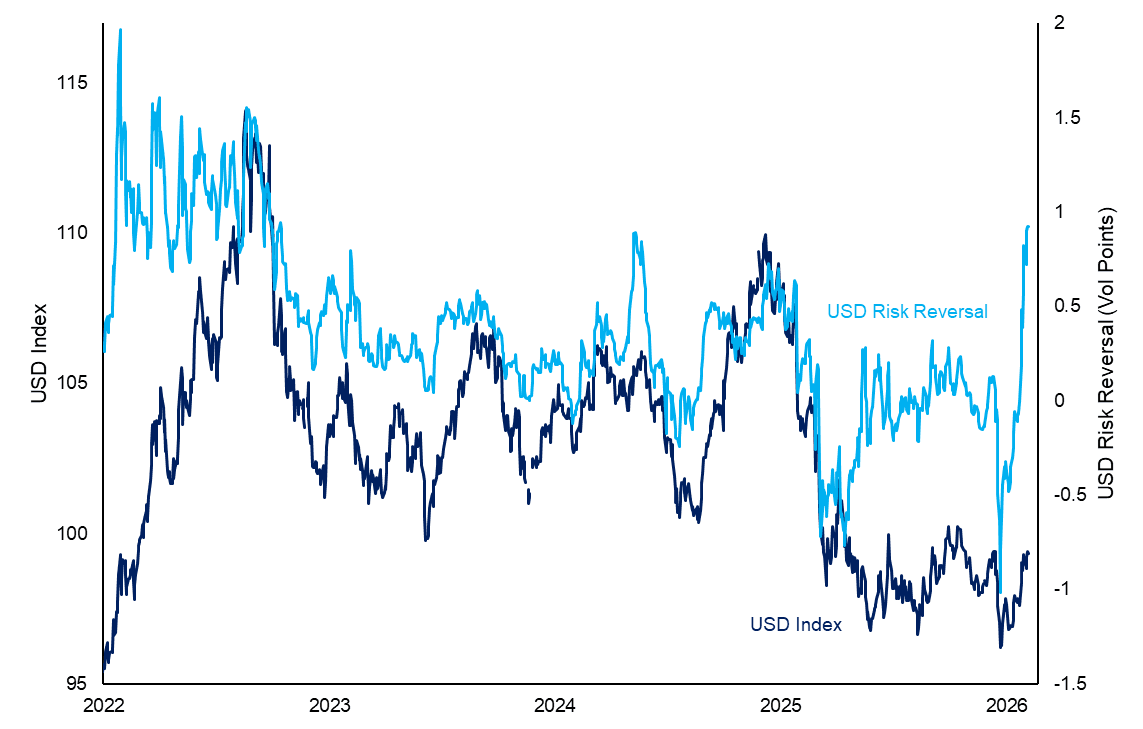
Source: MNI / Bloomberg Finance L.P.
- We wrote yesterday that markets are monitoring the next major macro trigger that could prompt a test of the technically significant 100.26 - 96.38 range in the USD Index, and that both the late January weakness and the early March recovery are signals of USD's sensitivity to global geopolitics.
- Resultantly, the next steps for the Strait of Hormuz and US appetite for an extended presence in Iran are inextricably linked with the USD Index in the near-term and the longer oil prices trade at the upper-end of the YTD range, the more likely a test of channel resistance will be:
Figure 2: USD Index daily candle chart (full size image here: https://emedia.marketnews.com/marketnewsintl/DXY1.png )

Source: MNI / Bloomberg Finance L.P.
FOREIGN EXCHANGE
EURUSD TECHS: Fresh Cycle Low
- RES 4: 1.1835 High Feb 23
- RES 3: 1.1727 50-day EMA
- RES 2: 1.1686 20-day EMA
- RES 1: 1.1575/1667 High Mar 12 / 10
- PRICE: 1.1438 @ 08:29 GMT Mar 13
- SUP 1: 1.1419 1.618 proj of the Jan 27 - Feb 6 - 10 price swing
- SUP 2: 1.1392 Low Aug 1 ‘25
- SUP 3: 1.1373 1.764 proj of the Jan 27 - Feb 6 - 10 price swing
- SUP 4: 1.1340 38.2% retracement of the Feb 3 ‘25 - Jan 27 bull cycle
A downtrend in EURUSD remains intact and today’s fresh cycle low reinforces current conditions. The breach of Monday’s 1.1507 low confirms a resumption of the downtrend and paves the way for an extension towards 1.1373, a Fibonacci projection. Note that moving average studies are in a bear-mode position. This highlights a medium-term bearish condition. First key resistance is 1.1667, the Mar 10 high.
GBPUSD TECHS: Trend Needle Points South
- RES 4: 1.3712 High Feb 11
- RES 3: 1.3662 High Feb 16
- RES 2: 1.3575 High Feb 26 and a key S/T resistance
- RES 1: 1.3482 50-day EMA
- PRICE: 1.3325 @ 06:22 GMT Mar 13
- SUP 1: 1.3253 Low Mar 03 and the bear trigger
- SUP 2: 1.3212 76.4% retracement of the Nov 4 ‘25 - Jan 27 bull cycle
- SUP 3: 1.3180 Low Dec 2 ‘25
- SUP 4: 1.3125 Low Nov 26 ‘25
The pullback from Tuesday’s high in GBPUSD signals the end of the recent corrective bounce. This leaves resistance at the 50-day EMA, at 1.3482, intact. Sights are on 1.3253, the Mar 3 low, where a break would confirm a resumption of the downtrend and open 1.3212, a Fibonacci retracement. On the upside, key resistance is seen at 1.3575, the Feb 26 high. Clearance of this level would signal a possible reversal.
EURGBP TECHS: Key Support Remains Exposed
- RES 4: 0.8818 High Nov 26 ‘25
- RES 3: 0.8806 76.4% retracement of the Nov 14 - Feb 4 bear leg
- RES 2: 0.8739/89 High Mar 3 / High Feb 27 and key S/T resistance
- RES 1: 0.8661/8698 High Mar 10 / 50-day EMA
- PRICE: 0.8629 @ 06:29 GMT Mar 13
- SUP 1: 0.8618 Low Mar 12
- SUP 2: 0.8613 Low Feb 04 and bear trigger
- SUP 3: 0.8597 Low Aug 14
- SUP 4: 0.8578 Low Jul 2 ‘25
EURGBP is trading just above this week’s low print. A bear cycle remains intact and sights are on 0.8613, the Feb 4 low and bear trigger. A clear break of this level would strengthen a bear theme and signal scope for a deeper retracement of the Dec ‘24 - Nov ‘25 bull phase. Key short-term resistance has been defined at 0.8789, the Feb 27 high. The first important resistance to watch is the 50-day EMA at 0.8698.
USDJPY TECHS: Bull Cycle Extension
- RES 4: 160.79 1.500 proj of the Jan 27 - Feb - 12 price swing
- RES 3: 160.26 Low Jul 8 ‘24
- RES 2: 160.00 Psychological round number
- RES 1: 159.69 Intraday high
- PRICE: 159.39 @ 07:05 GMT Mar 13
- SUP 1: 158.57/156.96 Low Mar 12 / 20-day EMA
- SUP 2: 156.19 50-day EMA
- SUP 3: 155.35/154.00 Low Feb 25 / 23
- SUP 4: 152.89 Trendline support drawn from the Apr 22 ‘25 low
USDJPY has traded to a fresh short-term cycle high. The pair has pierced key short-term resistance at 159.45, the Jan 14 high, and this break confirms a resumption of the bull cycle that started Apr 22 last year. The move higher paves the way for a climb towards the 160.00 psychological barrier. On the downside, initial firm support lies at 156.19, the 50-day EMA. Support at the 20-day EMA is at 156.96.
EURJPY TECHS: Has Pierced Key Channel Support
- RES 4: 186.87 High Jan 23 and a key M/T resistance
- RES 3: 186.36 High Feb 9
- RES 2: 185.05 76.4% retracement of the Feb 9 - 12 bear leg
- RES 1: 184.08/77 High Mar 11 / High Feb 25 and a S/T bull trigger
- PRICE: 182.47 @ 08:31 GMT Mar 13
- SUP 1: 182.30 Intraday low
- SUP 2: 180.81 Low Feb 12
- SUP 3: 180.10 Low Dec 5 ‘25
- SUP 4: 179.30 23.6% of the Feb 28 ‘25 - Jan 23 bull cycle
EURJPY has once again pierced key support at 183.10, the base of a bull channel drawn from the Feb 28 ‘25 low. For bears, a clear channel breakout would signal a stronger reversal and open another key support at 181.81, the Feb 12 low.Initial firm resistance to monitor is 184.77, the Feb 25 high. Clearance of this hurdle would instead highlight the resumption of a fresh bull wave inside the channel.
AUDUSD TECHS: Monitoring Support
- RES 4: 0.7284 High Jun’22
- RES 3: 0.7256 2.500 proj of the Nov 21 - Dec 10 - 18 price swing
- RES 2: 0.7208 61.8% of the Feb 25 ‘21 - Apr 9 ‘25 bear leg
- RES 1: 0.7187 High Mar 11 and the bull trigger
- PRICE: 0.7024 @ 08:32 GMT Mar 13
- SUP 1: 0.7016 Intraday low
- SUP 2: 0.6963 50-day EMA and key support
- SUP 3: 0.6897 Low Feb 6
- SUP 4: 0.6834 Low Jan 23
AUDUSD has pulled back from Wednesday’s high. For now, the move down is considered corrective and attention turns to key support at 6963.00, the 50-day EMA. A clear break of this average would undermine the current bullish theme. Note that the moving average set-up is in a bull mode position signalling a dominant uptrend. A resumption of gains would open 0.7208 next, a Fibonacci retracement point.
USDCAD TECHS: Resistance Intact For Now
- RES 4: 1.3845 High Jan 22
- RES 3: 1.3800 High Jan 23
- RES 2: 1.3753 High Mar 03 and key resistance
- RES 1: 1.3691 50-day EMA
- PRICE: 1.3664 @ 08:17 GMT Mar 13
- SUP 1: 1.3526 Low Mar 09
- SUP 2: 1.3482 Low Jan 30 and the bear trigger
- SUP 3: 1.3420 Low Sep 25 ‘24
- SUP 4: 1.3400 50.0% retracement of the 2021 - 2025 uptrend
USDCAD is firmer, however for now price remains inside a range. The trend condition is bearish - moving average studies continue to highlight a dominant downtrend. Resistance to watch is 1.3753, the Mar 3 high where a break would highlight a breach of both the 20- and 50-day EMAs and signal a stronger bull cycle. A resumption of weakness would refocus attention on 1.3482, the Jan 30 low and bear trigger.
FIXED INCOME
BUND TECHS: (M6) Breaches Key Support
- RES 4: 128.62 High Mar 3
- RES 3: 128.28 High Mar 4
- RES 2: 127.51 20-day EMA
- RES 1: 126.42/80 High Mar 12 / Low Mar 10
- PRICE: 125.78 @ 07:27 GMT Mar 13
- SUP 1: 125.73 Intraday low
- SUP 2: 125.49 1.382 proj of the Mar 2 - 3 - 4 price swing
- SUP 3: 125.25 1.500 proj of the Mar 2 - 3 - 4 price swing
- SUP 4: 125.00 Round number support
A bear cycle in Bund futures remains intact and today’s fresh cycle low reinforces current conditions. The contract has traded through a key support at 125.90, the Dec 22 low. The breach strengthens a bearish theme. Note too that 125.78, a 1.236 projection of the Mar 2 - 3 - 4 price swing, has been pierced. Scope is seen for a move to the next Fibonacci projection, at 125.49. Initial key resistance is 127.51, the 20-day EMA.
BOBL TECHS: (M6) Trend Condition Remains Bearish
- RES 4: 117.650 High Mar 3
- RES 3: 117.470 High Mar 4
- RES 2: 117.026 20-day EMA
- RES 1: 116.530 Low Mar 10
- PRICE: 116.080 @ 06:10 GMT Mar 13
- SUP 1: 115.580 Low Mar 9
- SUP 2: 115.508 1.382 proj of the Mar 2 - 3 - 4 price swing
- SUP 3: 115.340 1.500 proj of the Mar 2 - 3 - 4 price swing
- SUP 4: 115.000 Round number support
The trend condition in Bobl futures remains bearish. The sharp recovery from Monday’s low has allowed an oversold trend condition to unwind and for now short-term gains are considered corrective. A resumption of the downtrend would signal scope for an extension towards 115.508 next, a Fibonacci projection. Initial firm resistance is 117.026, the 20-day EMA. A clear break of this EMA would signal a possible reversal.
SCHATZ TECHS: (M6) Trend Needle Points South
- RES 4: 106.800 High Mar 3
- RES 3: 106.745 High Mar 4
- RES 2: 106.611 20-day EMA
- RES 1: 106.350 Low Mar 10
- PRICE: 106.135 @ 06:35 GMT Mar 13
- SUP 1: 106.045 Low Mar 12
- SUP 2: 105.896 1.618 proj of theMar 2 - 3 - 4 price swing
- SUP 3: 105.819 1.767 projection of the Mar 2 - 3 - 4 price swing
- SUP 4: 105.695 1.767 projection of the Mar 2 - 3 - 4 price swing
For now, the recent move higher in Schatz futures appears to have been a correction and this has allowed an extreme oversold trend condition to unwind. Short-term trend signals continue to highlight a dominant downtrend. A resumption of weakness would pave the way for an extension towards 105.896 next, a 1.1618 projection of the Mar 2 - 3 - 4 price swing. On the upside, initial firm resistance is seen at 106.611, the 20-day EMA.
GILT TECHS: (M6) Bearish Trend Sequence
- RES 4: 92.47 High Mar 3 and a gap low on the daily chart
- RES 3: 92.15 High Mar 5
- RES 2: 91.2420-day EMA
- RES 1: 89.70 High Mar 12
- PRICE: 88.66 @ 08:16 Mar 13
- SUP 1: 88.47 1.500 proj of the Feb 27 - Mar 3 - 4 rice swing
- SUP 2: 88.17 1.618 proj of the Feb 27 - Mar 3 - 4 rice swing
- SUP 3: 88.00 Round number support
- SUP 4: 87.79 1.764 proj of the Feb 27 - Mar 3 - 4 rice swing
A volatile bear cycle in Gilt futures remains intact. The breach of support at 88.80 the Mar 9 low, confirms a resumption of the downtrend and maintains the current bearish sequence of lower lows and lower highs. The break lower opens 88.47 and 88.17 next, Fibonacci projection points. Note that the trend is in an extreme oversold position. A recovery would allow this set-up to unwind. Initial firm resistance to monitor is at the 20-day EMA, at 91.24.
BTP TECHS: (M6) Volatile Bear Cycle Still In Play
- RES 4: 122.04 High Feb 27
- RES 3: 120.95 76.4% retracement of the Feb 27 - Mar 9 bear leg
- RES 2: 119.94 20-day EMA
- RES 1: 118.97 High Mar 9
- PRICE: 117.39 @ 08:20 GMT Mar 13
- SUP 1: 117.16 Intraday low
- SUP 2: 117.01 1.618 proj of the Feb 27 - Mar 3 - 4 price swing
- SUP 3: 116.68 1.764 proj of the Feb 27 - Mar 3 - 4 price swing
- SUP 4: 116.14 2.000 proj of the Feb 27 - Mar 3 - 4 price swing
The sharp reversal higher in BTP futures from Monday’s low and Wednesday’s pullback, highlights the fact that price action is set to remain volatile - for now. A bearish threat remains present and today’s fresh cycle low reinforces this bearish theme. Sights are on 117.01 and 116.68 next, Fibonacci projection points. Key short-term resistance to monitor is 119.94, the 20-day EMA.
EQUITIES
EUROSTOXX50 TECHS: (H6) SHort-Term Gains Appear Corrective
- RES 4: 6083.00 High Mar 2
- RES 3: 6000.00 High Mar 3
- RES 2: 5919.41 50-day EMA
- RES 1: 5882.00 High Mar 10
- PRICE: 5747.00 @ 06:30 GMT Mar 13
- SUP 1: 5653.00/5522.00 Low Mar 6 / 9
- SUP 2: 5500.00 Low Nov 21 ‘25 and a key support
- SUP 3: 5344.79 1.236 proj of the Feb 26 - Mar 3 - 5 price swing
- SUP 4: 5276.61 1.382 proj of the Feb 26 - Mar 3 - 5 price swing
The sharp rebound in EUROSTOXX 50 futures from Monday’s low is for now, considered corrective and this is allowing an extreme oversold trend condition to unwind. Key short-term resistance to watch is 5919.41, the 50-day EMA. A clear break of this average is required to signal a possible reversal. A resumption of the bear leg would open 5500.00, the Nov 21 ‘25 low. A clear breach of it would strengthen the bear cycle.
E-MINI S&P: (H6) Sights Are On Key Support
- RES 4: 6983.75 High Feb 25
- RES 3: 6878.09 50-day EMA
- RES 2: 6839.26 20-day EMAl
- RES 1: 6769.50 High Mar 12
- PRICE: 6645.50 @ 08:27 GMT Mar 13
- SUP 1: 6640.00 Intraday low
- SUP 2: 6583.00 Low Nov 21 ‘25 and a key medium-term support
- SUP 3: 6534.52 1.382 proj of the Feb 25 - Mar 3 - 5 price swing
- SUP 4: 6503.25 1.500 proj of the Feb 25 - Mar 3 - 5 price swing
A sharp bounce in S&P E-Minis on Monday and the reversal from Tuesday’s high highlights the fact that recent gains were most likely corrective. This has allowed a recent oversold trend condition to unwind. A continuation lower would open 6583.00, the Nov 21 ‘25 low and the next key medium-term support. Clearance of this level would strengthen a bearish threat. Initial firm resistance is 6878.09, the 50-day EMA.
COMMODITIES
BRENT TECHS: (K6) Uptrend Remains Intact
- RES 4: $125.19 - High Jun 14 ‘22 (cont) and a key resistance
- RES 3: $121.88 - High Jun 15 ‘22 (cont)
- RES 2: $120.08 - 76.4% retracement of the Mar ‘22 - Apr ‘25 Bear leg
- RES 1: $104.85/110.45 61.8% and 76.4% of the Mar 9 - 10 sell-off
- PRICE: $102.09 @ 08:29 GMT Mar 13
- SUP 1: $86.24 - Low Mar 11
- SUP 2: $81.66 - 20-day EMA
- SUP 3: $73.42 - 50-day EMA
- SUP 4: $66.21 - Low Feb 17
A volatile bull wave in Brent futures remains intact - for now. The sharp pullback from Monday’s high has allowed a recent extreme overbought trend condition to unwind. Key supports to monitor are $81.66 and - $73.42, the 20- and 50-day EMAs. A clear break through this support zone would signal a possible trend reversal. A continuation higher near-term would open $110.45 next, a Fibonacci retracement.
WTI TECHS: (J6) Volatile Bull Cycle Still In Play
- RES 4: $123.68 - High Jun 14 ‘22 (cont) and a key resistance
- RES 3: $120.00 - Psychological round number
- RES 2: $109.39 - 76.4% retracement of the Mar 9 - 10 sell-off
- RES 1: $103.15 - 61.8% retracement of the Mar 9 - 10 sell-off
- PRICE: $96.72 @ 07:20 GMT Mar 13
- SUP 1: $81.79 - Low Mar 11
- SUP 2: $76.92 - 20-day EMA
- SUP 3: $68.95 - 50-day EMA
- SUP 4: $63.60 - Low Feb 26
A volatile impulsive bull wave in WTI futures remains intact. The recent sharp pullback has allowed an extreme overbought trend condition to unwind. A key support zone to monitor is $76.92 - $68.95, the area between the 20- and 50-day EMAs. A clear break through this zone would signal a possible trend reversal. On the upside, a continuation higher near-term would open $103.15 next, a Fibonacci retracement.
GOLD TECHS: Trend Structure Remains Bullish
- RES 4: $5700.0 - Round number resistance
- RES 3: $5654.3 - 2.500 proj of the Nov 18 - Dec 26 - 31‘25 swing
- RES 2: $5595.5 - High Jan 29 and key resistance
- RES 1: $5419.1 - High Mar 2
- PRICE: $5076.9 @ 07:24 GMT Mar 13
- SUP 1: $4996.6 - Low Mar 3
- SUP 2: $4921.6 - 50-day EMA
- SUP 3: $4843.5 - Low Feb 17
- SUP 4: $4655.7 - Low Feb 6
Gold remains in consolidation mode and is trading below $5419.11, the Mar 2 high. A short-term bullish theme is intact following recent gains. The metal has cleared all key retracement points of the sharp sell-off between Jan 29 - Feb 2. This strengthens the short-term bullish theme and signals scope for an extension towards key resistance and the bull trigger at $5595.5, the Jan 29 high. Initial firm support to watch lies at $4921.6, the 50-day EMA.
SILVER TECHS: Challenging Support
- RES 4: $121.654 - High Jan 30 and key resistance
- RES 3: $108.071 - 76.4% retracement of the Jan 29 - Feb 6 sell-off
- RES 2: $100.000 - Round number resistance
- RES 1: $97.804 - High Mar 2
- PRICE: $82.078 @ 08:19 GMT Mar 13
- SUP 1: $81.644 - Intraday low
- SUP 2: $77.982 - Low Mar 3
- SUP 3: $72.020 - Low Feb 17
- SUP 4: $64.098 - Low Feb 6 and the bear trigger
A short-term bull cycle in Silver is intact and the recent pullback appears corrective - for now. A resumption of gains would pave the way for a climb towards $99.668, the 61.8% retracement of the sell-off between Jan 29 - Feb 6. A move through this price point would expose 108.071, the 76.4% retracement. Key S/T support to watch lies at $82.422 (pierced), the 50-day EMA. A clear breach of it would be a bearish development.