MNI DAILY TECHNICAL ANALYSIS - Bearish Conditions Persist in E-mini S&P
Price Signal Summary – Bearish Conditions Persist in E-mini S&P
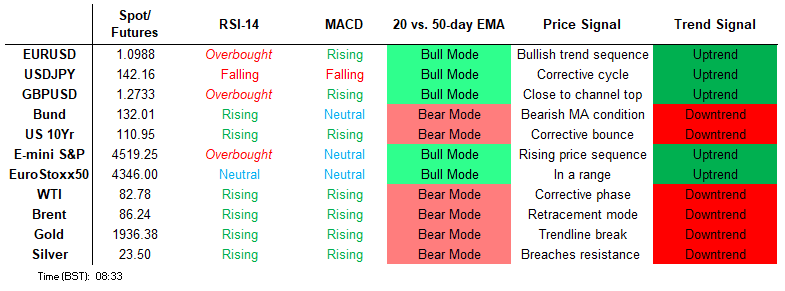
- Bearish conditions in the E-mini S&P contract remain intact. Last week’s move lower reinforces a bearish theme and resulted in a break of support around the 20-day EMA. The recent failure at the top of the bull channel also highlights a bearish development and the risk of an extension lower near-term. Gains in Eurostoxx 50 futures stalled last week at 4513.00 on Jul 31, and the contract reversed sharply lower over the week. Price has cleared both the 20- and 50-day EMAs, highlighting a stronger bearish threat. Note too, that key support at 4331.00, the Jul 26 low, has been breached.
- The outlook in GBPUSD remains bearish and short-term gains are considered corrective. Last week’s price action reinforced a bearish theme. The pair has breached a key support highlighted by the 50-day EMA, at 1.2744, and 1.2765, the base of a bull channel. Bullish conditions in USDJPY remain intact and the latest pullback appears to be a correction. Attention is on resistance at 144.20, the Jul 7 high. Clearance of this level would open key resistance and the bull trigger at 145.07, the Jun 30 high. AUDUSD bears remain in the driver’s seat and the pair is trading closer to its recent lows. Price remains below both the 20- and 50-day EMAs, reinforcing current conditions. Last week’s move lower resulted in a break of support at 0.6596, the Jun 29 low.
- Gold traded lower last week and the yellow metal remains closer to its recent lows. Last week’s move lower confirmed an extension of the bear cycle that started Jul 20. This signals scope for a move towards $1924.5, the Jul 11 low. The uptrend in WTI futures remains intact and Friday’s gains confirmed a resumption of the bull cycle. The move higher maintains the bullish price sequence of higher highs and higher lows. Note that moving average studies are in a bull mode position.
- Bund futures remain vulnerable and last week’s move lower reinforces a bearish theme. Price has breached 132.23, 61.8% of the Jul 10 - 19 rally. This undermined the recent bullish theme and signalled scope for an extension lower. Bearish conditions in Gilt futures remain intact and last week’s extension reinforces current conditions. The contract has recently breached support at 96.11, the Jul 21 low, and cleared the 20-day EMA, reinforcing a bearish theme.
EURUSD TECHS: Gains Considered Corrective
- RES 4: 1.1313 High Feb 24 2022
- RES 3: 1.1276 High Jul 18 and the bull trigger
- RES 2: 1.1150/1229 High Jul 27 / 20
- RES 1: 1.1042 High Aug 4
- PRICE: 1.0994 @ 05:37 BST Aug 7
- SUP 1: 1.0912 Low Aug 3 and the near-term bear trigger
- SUP 2: 1.0867 Low Jul 7
- SUP 3: 1.0834 Low Jul 6 and a key support
- SUP 4: 1.0804 Low Jun 15
The recovery in EURUSD on Friday, is considered corrective and the overarching trend remains lower. Last week’s bearish extension resulted in a break of trendline support drawn off the May 31 low and the 50-day EMA. The move strengthens the current bearish theme and opens the 1.0867 Jul 7 low initially ahead of key support 1.0834, the Jul 6 low. Initial resistance is seen at 1.1042, Friday’s high.
GBPUSD TECHS: Outlook Remains Bearish
- RES 4: 1.3142 High Jul 14 and the bull trigger
- RES 3: 1.3045 High Jul 19
- RES 2: 1.2887/2996 High Jul 28 / 27 and a key resistance
- RES 1: 1.2820 20-day EMA
- PRICE: 1.2734 @ 05:57 BST Aug 07
- SUP 1: 1.2621 Low Aug 3
- SUP 2: 1.2591 Low Jun 29
- SUP 3: 1.2480 1.50 projection of the Jul 14 - 24 - 27 price swing
- SUP 4: 1.2439 1.618 projection of the Jul 14 - 24 - 27 price swing
The outlook in GBPUSD remains bearish and short-term gains are considered corrective. Last week’s price action reinforced a bearish theme. The pair has breached a key support highlighted by the 50-day EMA, at 1.2744, and 1.2765, the base of a bull channel drawn from the Mar 8 low. This strengthens the downtrend and signals scope for weakness towards 1.2591, the Jun 29 low. First resistance is at 1.2820, the 20-day EMA.
EURGBP TECHS: Corrective Cycle Still In Play
- RES 4: 0.8749 50.0% retracement of the Feb 3 - Jun 19 downleg
- RES 3: 0.8719 High May 23 and a congestion high
- RES 2: 0.8678/8701 100-dma / High Jul 19
- RES 1: 0.8656 High Aug 3
- PRICE: 0.8634 @ 06:10 BST Aug 7
- SUP 1: 0.8597/44 20-day EMA / Low Jul 27
- SUP 2: 0.8508 1.0% 10-dma envelope
- SUP 3: 0.8504 Low Jul 11 and key support
- SUP 4: 0.8471 Low Aug 29 2022
Recent short-term gains in EURGBP appear to be a correction. The cross is trading closer to its recent highs and this does suggest that the correction remains in play for now. A resumption of gains would signal scope for a test of key short-term resistance at 0.8701, the Jul 19 high. Moving average studies continue to highlight a dominant downtrend - a break of 0.8544, the Jul 27 low, would strengthen a bearish theme.
USDJPY TECHS: Uptrend Remains Intact
- RES 4: 146.38 1.764 projection of the Jul 14 - 21 - 28 price swing
- RES 3: 145.69 1.618 projection of the Jul 14 - 21 - 28 price swing
- RES 2: 145.07 High Jun 30 and a bull trigger
- RES 1: 144.20 High Jul 7
- PRICE: 142.12 @ 06:22 BST Aug 7
- SUP 1: 141.48/140.62 20- and 50-day EMA values
- SUP 2: 138.07 Low Jul 28
- SUP 3: 137.25 Low Jul 14 and key support
- SUP 4: 136.31 Low May 17
Bullish conditions in USDJPY remain intact and the latest pullback appears to be a correction. Attention is on resistance at 144.20, the Jul 7 high. Clearance of this level would open key resistance and the bull trigger at 145.07, the Jun 30 high. Moving average studies are in a bull mode condition highlighting current positive market sentiment. On the downside, initial support to watch lies at 141.48, the 20-day EMA.
EURJPY TECHS: Key Resistance Remains Exposed
- RES 4: 159.92 2.236 proj of the May 11 - 29 - 31 price swing
- RES 3: 158.72 2.00 proj of the May 11 - 29 - 31 price swing
- RES 2: 158.05 High Jul 21 and the bull trigger
- RES 1: 157.50 High Aug 2
- PRICE: 156.11 @ 06:42 BST Aug 7
- SUP 1: 155.54 Low Aug 3
- SUP 2: 154.32 50-day EMA
- SUP 3: 151.42 Low Jul 28 and key support
- SUP 4: 150.16 38.2% retracement of the Jan 3 - Jul 21 bull cycle
Short-term conditions in EURJPY remain bullish and the cross is trading closer to its recent highs. A resumption of gains would expose 158.05, the Jul 21 high and the bull trigger. Clearance of this level would confirm a continuation of the medium-term uptrend that would open 158.72, a Fibonacci projection. Key support is at 151.42, the Jul 28 low. Initial firm support is at 154.32, the 50-day EMA.
AUDUSD TECHS: Trading Closer To This Week’s Lows
- RES 4: 0.6900 High Jun 16 and a bull trigger
- RES 3: 0.6847 High Jul 20
- RES 2: 0.6821 High Jul 27
- RES 1: 0.6630/6697 High Aug 2 / 50-day EMA
- PRICE: 0.6571 @ 07:02 BST Aug 7
- SUP 1: 0.6514 Low Aug 3
- SUP 2: 0.6485 Low Jun 1
- SUP 3: 0.6458 Low May 31 and a bear trigger
- SUP 4: 0.6403 76.4% retracement of the Oct 13 ‘22 - Feb 2 bull leg
AUDUSD bears remain in the driver’s seat and the pair is trading closer to its recent lows. Price remains below both the 20- and 50-day EMAs, reinforcing current conditions. Last week’s move lower resulted in a break of support at 0.6596, the Jun 29 low, as well as 0.6562, 76.4% of the Oct 13 ‘22 - Feb 2 bull leg. This opens 0.6458, the May 31 low and bear trigger. Initial firm resistance is seen at 0.6697, the 50-day EMA.
USDCAD TECHS: Pierces Key Resistance
- RES 4: 1.3462 High Jun 5
- RES 3: 1.3441 61.8% retracement of the May 26 - Jul 14 downleg
- RES 2: 1.3427 High Jun 7
- RES 1: 1.3387/94 High Jul 7 and a key resistance / High Aug 4
- PRICE: 1.3382 @ 07:50 BST Aug 7
- SUP 1: 1.3291/57 50- and 20-day EMA values
- SUP 2: 1.3151/3093 Low Jul 31 / 14 and the bear trigger
- SUP 3: 1.3084 1.618 proj of the Apr 28 - May 8 - May 26 price swing
- SUP 4: 1.3032 1.764 proj of the Apr 28 - May 8 - May 26 price swing
USDCAD short-term conditions remain bullish following last week’s strong recovery. Resistance at the 50-day EMA, which intersects at 1.3291, has been cleared. The move higher signalled scope for a test of the next key resistance at 1.3387, the Jul 7 high. This level has been pierced, a clear break would strengthen bullish conditions. Key support has been defined at 1.3093, the Jul 14 low. Initial support to watch is 1.3257, the 20-day EMA.
FIXED INCOME
BUND TECHS: (U3) Bear Cycle Remains In Play
- RES 4: 135.00 High Jun 27 and key resistance
- RES 3: 134.88 High Jul 19
- RES 2: 133.17/134.01 50-day EMA / High Jul 24
- RES 1: 132.77 20-day EMA
- PRICE: 132.26 @ 05:08 BST Aug 7
- SUP 1: 131.12 Low Aug 4
- SUP 2: 130.99 Low Jul 12
- SUP 3: 130.60 Low Jul 10 and a key support
- SUP 4: 130.00 Psychological round number
Bund futures remain vulnerable and last week’s move lower reinforces a bearish theme. Price has breached 132.23, 61.8% of the Jul 10 - 19 rally. This undermined the recent bullish theme and signalled scope for an extension lower. Friday’s sell-off has resulted in a break of 131.61, the 76.4% retracement. This opens key support at 130.60, the Jul 10 low. First resistance is at 132.77, the 20-day EMA.
BOBL TECHS: (U3) Bear Threat Remains Present
- RES 4: 116.990 High Jun 12 and a key resistance
- RES 3: 116.860 High Jun 13
- RES 2: 116.600 High Jul 19 and the bull trigger
- RES 1: 116.200 High Jul 24 and key near-term resistance
- PRICE: 115.740 @ 05:15 BST Aug 7
- SUP 1: 115.333/230 61.8% of the Jul 6 - 19 rally / Low Aug 4
- SUP 2: 115.230 Low Jul 13
- SUP 3: 115.034 76.4% retracement of the Jul 6 - 19 rally
- SUP 4: 114.730 Low Jul 12
On Jul 28 Bobl futures traded through support at 115.540, the Jul 21 / 26 low, before recovering. The break undermines the recent bullish theme and highlights a bearish threat. Friday’s move lower resulted in a print below 115.333, a Fibonacci retracement point and the next important support. A clear break of this level would strengthen a bearish threat. On the upside, key near-term resistance is unchanged at 116.200, the Jul 24 high.
SCHATZ TECHS: (U3) Trading Closer To Key Short-Term Resistance
- RES 4: 105.382 100-dma (cont)
- RES 3: 105.223 50% retracement June-July downleg
- RES 2: 105.185 High Jul 19 and key short-term resistance
- RES 1: 105.160 High Aug 3
- PRICE: 105.115 @ 05:27 BST Aug 7
- SUP 1: 104.990/805 20-day EMA / Low Jul 17
- SUP 2: 104.620/104.570 Low Jul 11 / 6 and the bear trigger
- SUP 3: 104.470 2.00 projection of the Jun 1 - 8 - 12 price swing
- SUP 4: 104.335 Low Mar 9 (cont) and a major support
A short-term uptrend in Schatz futures remains intact, for now, with immediate support at 104.805, the Jul 17 low, still intact. The contract is trading closer to key short-term resistance at 105.185, the Jul 19 high. A break of this level would highlight a continuation of the bull cycle and open 105.223 and 105.376, Fibonacci retracement points. On the downside, a breach of 104.805 would instead expose key support at 104.570, Jul 6 low.
GILT TECHS: (U3) Trend Needle Points South
- RES 4: 97.91 38.2% retracement of the Mar - Jul downleg (cont)
- RES 3: 97.84 High Jul 19 and the bull trigger
- RES 2: 96.19/81 High Jul 31 / 27
- RES 1: 95.40 20-day EMA
- PRICE: 94.84 @ Close Aug 4
- SUP 1: 93.70 Low Aug 4
- SUP 2: 93.45 76.4% retracement of the Jul 7 - 19 rally
- SUP 3: 92.82 Low Jul 12
- SUP 4: 92.09 Low Jul 7 and a key support
Bearish conditions in Gilt futures remain intact and last week’s extension reinforces current conditions. The contract has recently breached support at 96.11, the Jul 21 low, and cleared the 20-day EMA, reinforcing a bearish theme. Friday’s move lower resulted in a break of 94.58, the Jul 17 low and this opens 93.45 next, a Fibonacci retracement. Initial firm resistance is at 95.40, the 20-day EMA. Short-term gains are considered corrective.
BTP TECHS: (U3) Bear Leg Extends
- RES 4: 118.18 High Feb 2 (cont)
- RES 3: 117.60 High Jun 26 and the bull trigger
- RES 2: 116.86/117.48 High Jul 24 / 19
- RES 1: 115.49/116.14 20-day EMA / High Aug 2
- PRICE: 114.86 @ Close Aug 4
- SUP 1: 114.02/113.81 76.4% of the Jul 11 - 19 rally / Low Aug 4
- SUP 2: 112.95 Low Jul 11 and the bear trigger
- SUP 3: 112.48 Low May 29
- SUP 4: 111.78 Low May 26 and a key support
BTP futures traded lower last week, extending the downleg that started Jul 19. The move lower undermines a recent bullish theme and instead highlights a stronger bearish threat. The focus is on 114.02, a Fibonacci retracement point. This level was pierced Friday, a clear break of it would expose 112.95, the Jul 11 low and a key support. Initial firm resistance has been defined at 116.14, the Aug 1 high.
EQUITIES
EUROSTOXX50 TECHS: (U3) Maintains A Softer Tone
- RES 4: 4539.20 1.382 proj of the May 31 - Jul 3 - 7 price swing (cont)
- RES 3: 4515.00 High Nov / Dec 2007 (cont)
- RES 2: 4424.00/4513.00 High Aug 2 / High Jul 31 and the bull trigger
- RES 1: 4390.30 20-day EMA
- PRICE: 4337.00 @ 06:21 BST Aug 7
- SUP 1: 4295.00 Low Aug 3
- SUP 2: 4220.00 Low Jul 7 and a reversal trigger
- SUP 3: 4177.40 61.8% retracement of the Mar 20 - Jul 31 bull leg
- SUP 4: 4122.00 Low Mar 28
Gains in Eurostoxx 50 futures stalled last week at 4513.00 on Jul 31, and the contract reversed sharply lower over the week. Price has cleared both the 20- and 50-day EMAs, highlighting a stronger bearish threat. Note too, that key support at 4331.00, the Jul 26 low, has been breached. This strengthens a bearish theme and opens 4220.00, the Jul 7 low and a reversal trigger. Initial firm resistance is at 4424.00, the Aug 2 high.
E-MINI S&P TECHS: (U3) Bearish Cycle Still Intact
- RES 4: 4708.98 3.0% 10-dma envelope
- RES 3: 4670.58 2.00 proj of the Jun 26 - 20 - Jul 7 price swing
- RES 2: 4665.19 Bull channel top drawn from the Mar 13 low
- RES 1: 4593.50/4634.50 High Aug 2 / Jul 27
- PRICE: 4513.25 @ 06:43 BST Aug 7
- SUP 1: 4493.75 Low Aug 4
- SUP 2: 4453.93 50-day EMA
- SUP 3: 4423.98 Bull channel base drawn from the Mar 13 low
- SUP 4: 4411.25 Low Jul 10
Bearish conditions in the E-mini S&P contract remain intact. Last week’s move lower reinforces a bearish theme and resulted in a break of support around the 20-day EMA. The recent failure at the top of the bull channel also highlights a bearish development and the risk of an extension lower near-term. Further downside would open 4453.93, the 50-day EMA. First key resistance is at 4634.50, the Jul 27 high.
COMMODITIES
BRENT TECHS: (V3) Uptrend Resumes
- RES 4: $92.10 - 1.50 proj of the Jun 28 - Jul 13 - Jul 18 price swing
- RES 3: $90.63 - High Nov 11 2022 (cont)
- RES 2: $90.00 - Psychological round number
- RES 1: $86.73 - Intraday high
- PRICE: $86.10 @ 06:58 BST Aug 7
- SUP 1: $82.36/78.10 - Low Aug 3 / Low Jul 18 and key support
- SUP 2: $74.78 - Low Jul 6
- SUP 3: $72.04 - Low Jun 28
- SUP 4: $71.21 - Low My 31
Bullish conditions in Brent futures remain intact and Friday’s gains confirmed a resumption of the uptrend. This maintains the current bullish price sequence of higher highs and higher lows and signals scope for a climb to the psychological $90.00 handle next. Moving average studies remain in a bull mode position reflecting current market sentiment. First key support lies at $82.36, last Thursday’s low.
WTI TECHS: (U3) Trend Needle Points North
- RES 4: $87.43 - 1.382 proj of the Jun 28 - Jul 13 - Jul 17 price swing
- RES 3: $85.94 - High Aug 23 2022
- RES 2: $85.00 - Round number resistance
- RES 1: $83.59 - High Nov 7 2022
- PRICE: $82.74 @ 07:04 BST Aug 7
- SUP 1: $78.69/73.78 - Aug 3 low / Low Jul 17
- SUP 2: $69.82/66.98 - Low Jul 3 / Low Jun 12 and key support
- SUP 3: $64.22 - Low May 4 and the bear trigger
- SUP 4: $62.43 - Low Dec 2 2021 (cont)
The uptrend in WTI futures remains intact and Friday’s gains confirmed a resumption of the bull cycle. The move higher maintains the bullish price sequence of higher highs and higher lows. Note that moving average studies are in a bull mode position and this reinforces current bullish conditions. The focus is on $83.59, the Nov 7 2022 high. On the downside, initial firm support has been defined at $78.69, the Aug 3 low.
GOLD TECHS: Bear Threat Still Present
- RES 4: $2022.9 - 76.4% retracement of the May 4 - Jun 29 bear leg
- RES 3: $1990.8 - 2.0% 10-dma envelope
- RES 2: $1998.1 - 61.8% retracement of the May 4 - Jun 29 bear leg
- RES 1: $1972.4/1987.5 - High Jul 31 / High Jul 20 and the bull trigger
- PRICE: $1937.5 @ 07:19 BST Aug 7
- SUP 1: $1924.5 - Low Jul 11
- SUP 2: $1902.8 - Low Jul 6
- SUP 3: $1893.1 - Jun 29 and the bear trigger
- SUP 4: $1885.8 - Low Mar 15
Gold traded lower last week and the yellow metal remains closer to its recent lows. Last week’s move lower confirmed an extension of the bear cycle that started Jul 20. This signals scope for a move towards $1924.5, the Jul 11 low. Clearance of this level would suggest potential for an extension towards the key support at $1893.1, the Jun 29 low. Key resistance is at $1987.5, the Jul 20 high. A break would reinstate a bullish theme.
SILVER TECHS: Bear Cycle Remains In Play
- RES 4: $26.222 - High Apr 18 2022
- RES 3: $26.135 - High May 5 and bull trigger
- RES 2: $25.920 - High May 10
- RES 1: $24.104/25.267 - 20-day EMA / High Jul 20
- PRICE: $23.493 @ 08:00 BST Aug 7
- SUP 1: $23.109 - Low Jul 12
- SUP 2: $22.527 - Low Jul 6
- SUP 3: $22.111 - Low Jun 23 and a bear trigger
- SUP 4: $21.375 - 76.4% retracement of the Mar 10 - May 5 bull leg
Silver traded lower last week and prices are trading closer to recent lows. A bear cycle remains in play, for now. Support at the 50-day EMA has been cleared and this undermines a recent bullish outlook. A continuation lower would pave the way for a move towards $23.109, the Jul 2 low. Key resistance is at $25.267, the Jul 20 high. Initial resistance is at $24.104, the 20-day EMA.