MNI DAILY TECHNICAL ANALYSIS - AUD Cracks Bull Trigger
Price Signal Summary - AUD Cracks Bull Trigger
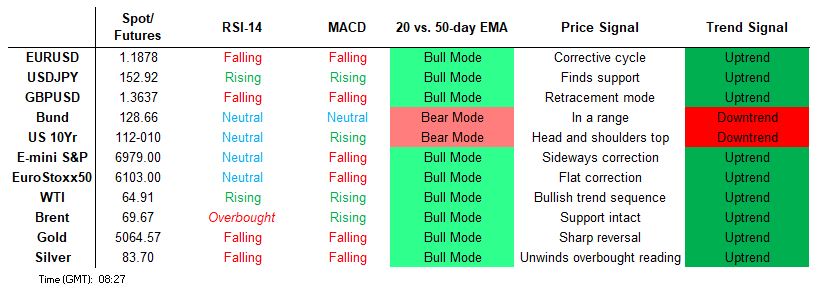
- The firm reversal higher on Feb 6 in S&P E-Minis refocuses attention on the primary uptrend and the key resistance at 7043.00, the Jan 28 high. Clearance of this level would confirm a resumption of the trend. The medium-term trend condition in EUROSTOXX 50 futures remains bullish and this week’s fresh cycle high reinforces the bull theme. The move higher paves the way for an extension towards 6100.00.
- The bounce in GBPUSD from 1.3509, the Feb 6 low, highlights a short-term bull reversal and signals the end of the corrective cycle between Jan 27 - Feb 6. Note that moving average studies continue to highlight a dominant medium-term uptrend. A bearish tone in USDJPY remains intact following a reversal from Monday's high. The move down has exposed key short-term support at 152.10, the Jan 27 low and bear trigger. The trend needle in AUDUSD continues to point north. Fresh cycle highs this week reinforce current conditions and confirm a resumption of the primary uptrend.
- The recent recovery in Gold highlights a retracement of the Jan 29 - Feb 2 sell-off. The next two resistance points to monitor are $5139.9 and $5314.0, Fibonacci retracement levels. A bull cycle in WTI futures remains intact. However, the reversal from the Jan 29 high continues to highlight a corrective cycle. Attention is on support at the 20-day EMA, at $62.55.
- A bull mode in Bund futures remains intact and the contract is holding on to its recent gains. The breach of resistance at 128.58, the Jan 19 high and a key short-term resistance, strengthens the short-term condition. Gilt futures continue to appreciate and the climb has resulted in a print above the 50-day EMA, at 91.20. A clear break of this average would highlight a stronger reversal and signal scope for an extension towards 91.73
[GLOBAL] MNI Tech Trend Monitor - Highlighting Longer-Term Trends:
- Refreshing the MNI Tech Trend Monitor, Adding USDZAR, USDCNH and the e-mini S&P chart, while refreshing levels for Gold, USD/JPY, EUR/GBP, EUR/HUF, USD/MXN, the European Banking Stock Index (SX7E) as well as UK Gilts.
See full document here: https://media.marketnews.com/MNI_Tech_Trend_Monitor_Jan26_cef40b4ef1.pdf
FOREIGN EXCHANGE
EURUSD TECHS: Bullish Theme
- RES 4: 1.2081 High Jan 27 and key resistance
- RES 3: 1.2007 76.4% retracement of the Jan 27 - Feb 6 bear leg
- RES 2: 1.1961 61.8% retracement of the Jan 27 - Feb 6 bear leg
- RES 1: 1.1929 High Feb 10
- PRICE: 1.1865 @ 06:10 GMT Feb 12
- SUP 1: 1.1821 20-day EMA
- SUP 2: 1.1766 Low Feb 06 and key short-term support
- SUP 3: 1.1693 76.4% retracement of the Jan 19 -0 27 bull leg
- SUP 4: 1.1670 Low Jan 22
A bullish theme remains intact in EURUSD following Monday’s rally that suggests the recent bearish correction has concluded. Note that moving average studies are in a bull-mode position, highlighting a dominant M/T uptrend. A resumption of gains would open 1.1961 and 1.2007, Fibonacci retracement points. Key resistance and the bull trigger is at 1.2081, the Jan 27 high. Key short-term support lies at 1.1766, the Feb 6 low.
GBPUSD TECHS: Support Remains Intact
- RES 4: 1.3889 1.00 proj of the Nov 4 - Jan 6 - Jan 19 price swing
- RES 3: 1.3868 High Jan 27 and the bull trigger
- RES 2: 1.3733/3814 High Feb 4 / high Jan 30
- RES 1: 1.3712 High Feb 11
- PRICE: 1.3616 @ 06:23 GMT Feb 12
- SUP 1: 1.3587 Low Feb 9
- SUP 2: 1.3517/09 50-day EMA / Low Feb 6
- SUP 3: 1.3458 76.4% retracement of the Jan 19 - 27 upleg
- SUP 4: 1.3402 Low Jan 22
The bounce in GBPUSD from 1.3509, the Feb 6 low, highlights a short-term bull reversal and signals the end of the corrective cycle between Jan 27 - Feb 6. Note that moving average studies continue to highlight a dominant medium-term uptrend. The next resistance to watch is 1.3733, the Feb 4 high. Clearance of this level would expose 1.3868, the Jan 27 high and a bull trigger. Key short-term support to watch lies at the 50-day EMA, at 1.3517.
EURGBP TECHS: Resistance Remains Intact For Now
- RES 4: 0.8797 High Dec 17
- RES 3: 0.8769 61.8% retracement of the Nov 14 - Feb 4 bear leg
- RES 2: 0.8746 High Jan 21 and a key resistance
- RES 1: 0.8729 100-dma
- PRICE: 0.8710 @ 06:46 GMT Feb 12
- SUP 1: 0.8685/8613 20-day EMA / Low Feb 04 and bear trigger
- SUP 2: 0.8597 Low Aug 14
- SUP 3: 0.8578 Low Jul 2 ‘25
- SUP 4: 0.8544 50.0% retracement of the Dec ‘24 - Nov ‘25 bull cycle
The latest recovery in EURGBP still appears corrective. However, the cross is approaching a key short-term pivot resistance at 0.8746, the Jan 21 high, where a break would highlight a potential trend reversal. Moving average studies are in a bear-mode position and this continues to highlight a dominant downtrend. A resumption of weakness would refocus attention on 0.8613, the Feb 4 low and bear trigger.
USDJPY TECHS: Reversal From Monday’s High Extends
- RES 4: 159.45 High Jan 14 and the bull trigger
- RES 3: 157.76 High Feb 9
- RES 2: 155.74 50-day EMA
- RES 1: 154.65 High Feb 11
- PRICE: 153.27 @ 07:01 GMT Feb 12
- SUP 1: 152.27/152.10 Low Feb 11 / Low Jan 27 and bear trigger
- SUP 2: 151.98 38.2% of the Apr 22 ‘25 - Jan 14 bull cycle
- SUP 3: 151.72 Trendline support drawn from the Apr 22 ‘25 low
- SUP 4: 151.54 Low Oct 29 ‘25
A bearish tone in USDJPY remains intact following a reversal from Monday's high. The move down has exposed key short-term support at 152.10, the Jan 27 low and bear trigger. A break of this level would highlight a stronger reversal and strengthen a bear cycle that started Jan 14. Note that a trendline support lies at 151.72 and also marks a key support. The line is drawn from the Apr 22 ‘25 low. Initial resistance is at 155.98, the 20-day EMA.
EURJPY TECHS: Pierces Channel Support
- RES 4: 187.71 3.000 proj of the Oct 17 - Oct 30 - Nov 5 price swing
- RES 3: 186.87 High Jan 23 and the bull trigger
- RES 2: 184.06/186.36 20-day EMA / High Feb 9
- RES 1: 183.12 50-day EMA
- PRICE: 181.63 @ 07:19 GMT Feb 12
- SUP 1: 180.90 Base of a bull channel drawn from the Feb 28 ‘25 low
- SUP 2: 180.10 Low Dec 5 ‘25
- SUP 3: 179.30 23.6% of the Feb 28 ‘25 - Jan 23 bull cycle
- SUP 4: 178.82 High Oct 30 ‘25
The sharp sell-off in EURJPY from Monday’s high has resulted in a break of a key short-term support at 181.79, the Jan 26 low. The breach strengthens a bearish threat and exposes bull channel support at 180.90 (pierced). The channel is drawn from the Feb 28 ‘25 low and represents an important key M/T support. A clear break of it would highlight a stronger reversal. Key resistance and the bull trigger is at 186.87, the Jan 23 high.
AUDUSD TECHS: Trend Needle Points North
- RES 4: 0.7208 61.8% of the Feb 25 ‘21 - Apr 9 ‘25 bear leg
- RES 3: 0.7186 2.236 proj of the Nov 21 - Dec 10 - 18 price swing
- RES 2: 0.7158 High Feb 2 2023
- RES 1: 0.7147 Intraday high
- PRICE: 0.7120 @ 07:52 GMT Feb 12
- SUP 1: 0.7007 Low Feb 9
- SUP 2: 0.6897 Low Feb 6 and key short-term support
- SUP 3: 0.6834 Low Jan 23
- SUP 4: 0.6810 50-day EMA
The trend needle in AUDUSD continues to point north. Fresh cycle highs this week reinforce current conditions and confirm a resumption of the primary uptrend. Note that moving average studies are in a bull-mode position and this continues to highlight a dominant medium-term uptrend. The break higher opens 0.7186 next, a Fibonacci projection. On the downside, initial key support lies at 0.6897, the Feb 6 low.
USDCAD TECHS: Bear Trigger Remains Exposed
- RES 4: 1.3929 High Jan 16 and a reversal trigger
- RES 3: 1.3879 High Jan 20
- RES 2: 1.3752 50-day EMA
- RES 1: 1.3669/3725 20-day EMA / High Feb 2 and a key resistance
- PRICE: 1.3580 @ 08:05 GMT Feb 12
- SUP 1: 1.3482 Low Jan 30 and the bear trigger
- SUP 2: 1.3473 Low Oct 2 ‘24
- SUP 3: 1.3400 50.0% retracement of the 2021 - 2025 uptrend
- SUP 4: 1.3359 Low Jan 31 2024
Despite Wednesday's bounce, a bear threat in USDCAD remains present and attention is on key support at 1.3482, the Jan 30 low. A break of this level would confirm a resumption of the medium-term downtrend and pave the way for an extension towards the 1.3400 handle, a Fibonacci retracement. Key short-term resistance has been defined at 1.3725, the Feb 2 high. A clear break of this hurdle would suggest scope for a strong S/T bull cycle instead.
FIXED INCOME
BUND TECHS: (H6) Holding On To Its Recent Gains
- RES 4: 129.55 High Nov 26 ‘25 and a key resistance
- RES 3: 129.24 High Dec 1
- RES 2: 128.89 76.4% retracement of the Nov 26 - Dec 22 bear leg
- RES 1: 128.76 High Jan 11
- PRICE: 128.64 @ 05:47 GMT Feb 12
- SUP 1: 128.15/51 20-day EMA / Low Jan 23
- SUP 2: 127.13 Low Jan 6
- SUP 3: 126.75 Low Dec 22 and the bear trigger
- SUP 4: 126.53 Low Mar 11 (cont.) and a key support
A bull mode in Bund futures remains intact and the contract is holding on to its recent gains. The breach of resistance at 128.58, the Jan 19 high and a key short-term resistance, strengthens the short-term condition. This signals scope for an extension towards 128.89, a Fibonacci retracement. Key support lies at 127.51, the Jan 23 low. Clearance of this level would signal a resumption of the recent downtrend. First support is 128.15, the 20-day EMA.
BOBL TECHS: (H6) Bull Cycle Intact
- RES 4: 117.140 High Nov 26 ‘25 and a key resistance
- RES 3: 117.020 High Nov 28 ‘25
- RES 2: 116.960 High Dec 1
- RES 1: 116.870 High Feb 12
- PRICE: 116.830 @ 06:07 GMT Feb 11
- SUP 1: 116.515 50-day EMA
- SUP 2: 116.290/140 Low Feb 3 and key S/T support / Low Jan 23
- SUP 3: 115.920 Low Jan 5
- SUP 4: 115.780 Low Dec 22
A bullish cycle in Bobl futures remains intact and this week’s fresh short-term cycle high, reinforces current conditions. The contract has pierced 116.805, the 76.4% retracement of the Nov 26 - Dec 10 bear leg. A clear break of this level would pave the way for a climb towards 116.960, the Dec 1 high. Initial firm support to watch lies at 116.290, the Feb 3 low. Clearance of this level would signal a reversal. First support is 116.515, the 50-day EMA.
SCHATZ TECHS: (H6) Resistance Remains Exposed
- RES 4: 107.030 High Nov 26
- RES 3: 107.000 Round number resistance
- RES 2: 106.959 76.4% retracement of the Nov 21 - Dec 10 bear leg
- RES 1: 106.955 High Feb 6
- PRICE: 106.915 @ 06:13 GMT Feb 12
- SUP 1: 106.869/815 20-day EMA / Low Feb 3 and a key S/T support
- SUP 2: 106.760 Low Jan 23
- SUP 3: 106.725 Low Jan 5
- SUP 4: 106.690 Low Dec 18 & 22
Schatz futures are trading closer to their recent highs. The contract has pierced resistance at 106.935, the Jan 21 / 29 high. A clear break of this hurdle would signal scope for a stronger recovery, potentially through 106.959, the 76.4% retracement of the Nov 21 - Dec 10 bear leg. Support to watch remains at 106.815, the Feb 3 low. A move through it would be bearish. Initial support lies at 106.874, the 20-day EMA.
GILT TECHS: (H6) Pierces The 50-Day EMA
- RES 4: 92.20 76.4% retracement of the Jan 14 - Feb 9 bear cycle
- RES 3: 92.13 High Jan 22
- RES 2: 91.73 61.8% retracement of the Jan 14 - Feb 9 bear cycle
- RES 1: 91.30 Intraday high
- PRICE: 91.07 @ 08:06 GMT Feb 12
- SUP 1: 90.62/89.76 Low Feb 11 / 9 and the bear trigger
- SUP 2: 89.73 1.382 proj of the Jan 14 - 20 - 22 price swing
- SUP 3: 89.52 1.500 proj of the Jan 14 - 20 - 22 price swing
- SUP 4: 89.06 1.764 proj of the Jan 14 - 20 - 22 price swing
Gilt futures continue to appreciate and the climb has resulted in a print above the 50-day EMA, at 91.20. A clear break of this average would highlight a stronger reversal and signal scope for an extension towards 91.73, a Fibonacci retracement point. It is still possible that the latest recovery is a correction. Initial support to watch lies at 90.62, the Feb 11 low. Clearance of this level would expose key support at 89.76, the Feb 9 low.
BTP TECHS: (H6) Bullish Trend Sequence
- RES 4: 122.40 1.0% 10-dma envelope
- RES 3: 122.00 Round number resistance
- RES 2: 121.87 2.000 proj of the Dec 10 - 17 - 22 price swing
- RES 1: 121.75 HIgh Feb 11
- PRICE: 121.67 @ Close Feb 11
- SUP 1: 121.06 20-day EMA
- SUP 2: 120.64 Trendline drawn from the Dec 10 low
- SUP 3: 120.36 Low Jan 20
- SUP 4: 119.72 Low Jan 6
A bullish theme in BTP futures remains intact and this week’s break higher reinforces current trend conditions and confirms a resumption of the medium-term uptrend. The contract has cleared resistance at 121.37, the Nov 13 ‘25 high. This paves the way for an extension towards 121.87 next, a Fibonacci projection. Short-term trendline support is at 120.64 - drawn from the Dec 10 low.
EQUITIES
EUROSTOXX50 TECHS: (H6) Fresh Cycle High Reinforces The Bull Theme
- RES 4: 6172.00 1.500 proj of the Nov 21 - Dec 12 - 18 price swing
- RES 3: 6134.00 1.382 proj of the Nov 21 - Dec 12 - 18 price swing
- RES 2: 6100.00 Round number resistance
- RES 1: 6098.00 Intraday high
- PRICE: 6089.00 @ 06:39 GMT Feb 12
- SUP 1: 5984.15 20-day EMA
- SUP 2: 5896.83/5865.00 50-day EMA / Low Feb 06
- SUP 3: 5838.00 Low Jan 20 and a bear trigger
- SUP 4: 5750.00 Low Dec 23
The medium-term trend condition in EUROSTOXX 50 futures remains bullish and this week’s fresh cycle high reinforces the bull theme. The move higher paves the way for an extension towards 6100.00, and 6134.00, a Fibonacci projection point. Key support to watch lies at the 50-day EMA, at 5896.83. Clearance of this average would highlight a short-term top and signal scope for a deeper pullback.
E-MINI S&P: (H6) Trend Needle Points North
- RES 4: 7080.92 0.764 proj of the Nov 21 - Dec 11 - 18 price swing
- RES 3: 7052.61 2.0% Upper Bollinger Band
- RES 2: 7043.00 High Jan 28 and bull trigger
- RES 1: 7018.26 1.0% 10-dma envelope
- PRICE: 6982.50 @ 07:25 GMT Feb 12
- SUP 1: 6923.60 50-day EMA
- SUP 2: 6751.50 Low Feb 6 and key short-term support
- SUP 3: 6691.56 76.4% retracement of the Nov 21 - Jan 28 bull leg
- SUP 4: 6583.00 Low Nov 211 and a key medium-term support
The firm reversal higher on Feb 6 in S&P E-Minis refocuses attention on the primary uptrend and the key resistance at 7043.00, the Jan 28 high. Clearance of this level would confirm a resumption of the trend and mark the end of a flat correction in the contract. Key short-term support has been defined at 6751.50, the Feb 6 low, where a break is required to highlight a top and a stronger short-term reversal.
COMMODITIES
BRENT TECHS: (J6) Fresh Cycle High
- RES 4: $75.93 - 2.00 proj of the Jan 5 - 14 - 19 price swing
- RES 3: $73.33 - High Jun 23 ‘25 and a key M/T resistance
- RES 2: $72.00 - Round number resistance
- RES 1: $70.72 - High Feb 11
- PRICE: $69.62 @ 07:15 GMT Feb 12
- SUP 1: $66.31 - 20-day EMA
- SUP 2: $64.41 - 50-day EMA
- SUP 3: $62.59 - Low Jan 19
- SUP 4: $59.44 - Low Jan 5
A bull theme in Brent futures is intact and yesterday’s cycle high reinforces this theme. Resistance at $70.58, the Jan 29 high and a bull trigger, has been pierced. A clear break of this level would confirm a resumption of the uptrend and pave the way for an extension towards the $72.00 handle. Support to watch lies at $66.82, the 20-day EMA, and $64.77, the 50-day EMA, The area between these two EMAs marks a key support zone.
WTI TECHS: (H6) Remains Above Support
- RES 4: $71.66 - 2.00 proj of the Jan 7 - 14 - 20 price swing
- RES 3: $69.80 - High Jun 23 ‘25 and a key medium-term resistance
- RES 2: $68.00 - Round number resistance
- RES 1: $66.48 - High Jan 30 and the bull trigger
- PRICE: $64.79 @ 07:21 GMT Feb 12
- SUP 1: $62.55/60.79 - 20- and 50-day EMA values
- SUP 2: $58.53 - Low Jan 20
- SUP 3: $55.65 - Low Jan 7
- SUP 4: $54.56 - Low Apr 9 ‘25 and a key support
A bull cycle in WTI futures remains intact. However, the reversal from the Jan 29 high continues to highlight a corrective cycle. Attention is on support at the 20-day EMA, at $62.55. The 50-day EMA lies at $60.79. A clear breach of the 50-day average would highlight a stronger reversal and open $58.53, the Jan 20 low. Key resistance and the bull trigger to watch has been defined at $66.48, the Jan 30 high. Clearance of it would resume the uptrend.
GOLD TECHS: In Retracement Mode
- RES 4: $5451.0 - High Jan 30
- RES 3: $5314.0 - 76.4% retracement of the Jan 29 - Feb 2 pullback
- RES 2: $5139.9 - 61.8% retracement of the Jan 29 - Feb 2 pullback
- RES 1: $5119.3 - High Feb 11
- PRICE: $5062.3 @ 07:28 GMT Feb 12
- SUP 1: $4655.7 - Low Feb 6
- SUP 2: $4403.0 - Low Feb 2 and the bear trigger
- SUP 3: $4274.7 - Low Dec 31 ‘25 and a key support
- SUP 4: $4170.3 - Low Dec 9
The recent recovery in Gold highlights a retracement of the Jan 29 - Feb 2 sell-off. The next two resistance points to monitor are $5139.9 and $5314.0, Fibonacci retracement levels. Note that the sharp sell-off from the Jan 29 high still highlights a potential top in the L/T trend and from a S/T perspective, an unwinding of the recent extreme overbought condition. A resumption of bearish activity would refocus attention on $4403.0, the Feb 2 low.
SILVER TECHS: Bearish Outlook
- RES 4: $121.654 - High Jan 30 and key resistance
- RES 3: $106.895 - Low Jan 29
- RES 2: $100.000 - Round number resistance
- RES 1: $86.941 - 20-day EMA
- PRICE: $83.826 @ 08:08 GMT Feb 12
- SUP 1: $64.098 - Low Feb 6
- SUP 2: $61.136 - 0.618 proj of the Jan 29 - Feb 2 - 4 price swing
- SUP 3: $53.797 - 0.618 proj of the Jan 29 - Feb 2 - 4 price swing
- SUP 4: $50.00 - Former key resistance area and major support
A sharp sell-off in Silver from the Feb 4 high confirmed a resumption of the bear leg that started on Jan 29. Note that the move lower since Jan 29 highlights an unwinding of the recent extreme overbought condition. The metal has traded through both the 20- and 50-day EMAs, signalling scope for a deeper retracement. Sights are on $61.136 next, a Fibonacci projection. Initial firm resistance is at 86.941, the 20-day EMA.