MNI DAILY TECHNICAL ANALYSIS - AUD Bounce Firms Bull Case
Price Signal Summary – Strong AUD Bounce Firms Bull Case
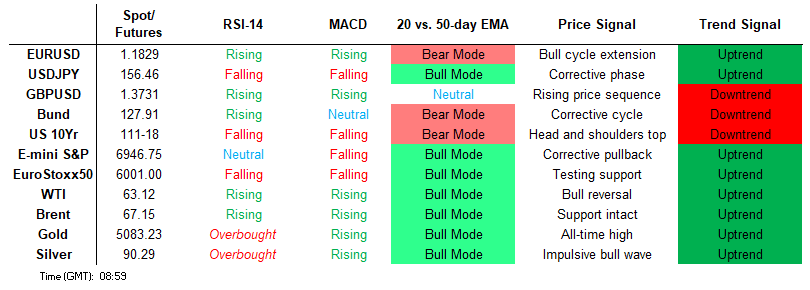
- The trend in S&P E-Minis remains bullish. The recovery from Monday’s low suggests that a recent bear threat merely resulted in a short-lived correction. Attention is on key resistance and the bull trigger at 7043.00. A bull cycle in EUROSTOXX 50 futures remains intact and this week’s gains reinforce this theme. Key support lies at the 50-day EMA at 5863.24. A clear breach of this average would signal scope for a deeper retracement.
- The latest pullback in GBPUSD is considered corrective and a continuation lower is allowing a recent overbought condition to unwind. The initial firm support to watch is at the 20-day EMA, at 1.3597. USDJPY is trading higher as the pair extends the recovery from the Jan 27 low. This week’s gains have resulted in a breach of resistance around the 50-day EMA, at 155.75. A bull cycle in AUDUSD remains in play and recent gains reinforce current trend conditions. However, the pullback between Jan 29 - Feb 2 continues to highlight a corrective phase.
- A bull theme in Brent futures remains intact, however, the sharp reversal from last week’s high highlights - for now - the start of a corrective cycle. Support to watch lies at $65.22, the 20-day EMA. The strong reversal in Silver from last week’s high confirms a top in the long-term trend - for now - and from a short-term perspective, highlights an unwinding of the recent extreme overbought condition.
- The trend outlook in Bund futures remains bearish and recent gains appear to have been a correction plus this week’s move down reinforces a bearish theme. A bullish theme in BTP futures remains intact and short-term pullbacks are for now, considered corrective. Resistance to watch is 121.37, the Nov 13 high, exposed.
[GLOBAL] MNI Tech Trend Monitor - Highlighting Longer-Term Trends:
- Refreshing the MNI Tech Trend Monitor, Adding USDZAR, USDCNH and the e-mini S&P chart, while refreshing levels for Gold, USD/JPY, EUR/GBP, EUR/HUF, USD/MXN, the European Banking Stock Index (SX7E) as well as UK Gilts.
See full document here: https://media.marketnews.com/MNI_Tech_Trend_Monitor_Jan26_cef40b4ef1.pdf
FOREIGN EXCHANGE
EURUSD TECHS: Corrective Cycle Remains In Play
- RES 4: 1.2081 High Jan 27 and key resistance
- RES 3: 1.2045 High Jan 28
- RES 2: 1.1975 High Jan 30
- RES 1: 1.1896 Low Jan 28
- PRICE: 1.1835 @ 06:05 GMT Feb 4
- SUP 1: 1.1776 Low Feb 2
- SUP 2: 1.1735 50-day EMA
- SUP 3: 1.1693 76.4% retracement of the Jan 19 -0 27 bull leg
- SUP 4: 1.1670 Low Jan 22
A corrective cycle in EURUSD remains in play following the sharp reversal from the Jan 27 high. Note that moving average studies remain in a bull-mode position and this suggests that the retracement has been a correction - for now. Support to watch is at the 50-day EMA, at 1.1735. A clear breach of this 50-day average would suggest scope for a deeper retracement. Initial firm resistance is at 1.1896, the Jan 28 low.
GBPUSD TECHS: Monitoring Support
- RES 4: 1.3913 High Sep 14 2021
- RES 3: 1.3889 1.00 proj of the Nov 4 - Jan 6 - Jan 19 price swing
- RES 2: 1.3868 High Jan 27 and the bull trigger
- RES 1: 1.3814 High Jan 30
- PRICE: 1.3717 @ 06:29 GMT Feb 04
- SUP 1: 1.3623 Low Feb 02
- SUP 2: 1.3597 20-day EMA
- SUP 3: 1.3487 50-day EMA
- SUP 4: 1.3402 Low Jan 22
The latest pullback in GBPUSD is considered corrective and a continuation lower is allowing a recent overbought condition to unwind. The initial firm support to watch is at the 20-day EMA, at 1.3597. Support at the 50-day EMA lies at 1.3479 - a pivot level. A clear break of the 50-day average would signal scope for a deeper retracement. The medium-term trend condition remains bullish. The bull trigger has been defined at 1.3868, the Jan 27 high.
EURGBP TECHS: Bearish Trend Sequence
- RES 4: 0.8797 High Dec 17
- RES 3: 0.8746 High Jan 21 and a key resistance
- RES 2: 0.8702 50-day EMA
- RES 1: 0.8675 20-day EMA
- PRICE: 0.8627 @ 06:41 GMT Feb 4
- SUP 1: 0.8620 38.2% of the Dec ‘24 - Nov ‘25 upleg & Low Feb 03
- SUP 2: 0.8597 Low Aug 14
- SUP 3: 0.8578 Low Jul 2 ‘25
- SUP 4: 0.8544 50.0% retracement of the Dec ‘24 - Nov ‘25 bull cycle
A bear cycle in EURGBP remains in play and this week’s break lower reinforces current conditions. The breach of 0.8466, the Jan 6 low and a bear trigger, confirms a resumption of the downtrend and maintains the price sequence of lower lows and lower highs. The next support to watch is 0.8620, a Fibonacci retracement and the Feb 03 low. Key resistance has been defined at 0.8746, the Jan 21 high.
USDJPY TECHS: Trades Through The 50-Day EMA
- RES 4: 159.45 High Jan 14 and the bull trigger
- RES 3: 159.23 High Jan 23
- RES 2: 157.72 76.4% retracement of the Jan 14 - 27 bear leg
- RES 1: 156.64 61.8% retracement of the Jan 14 - 27 bear leg
- PRICE: 156.35 @ 07:04 GMT Feb 4
- SUP 1: 154.55/152.10 Low Feb 2 / Low Jan 27 and the bear trigger
- SUP 2: 151.98 38.2% of the Apr 22 ‘25 - Jan 14 bull cycle
- SUP 3: 151.54 Low Oct 29 ‘25
- SUP 4: 150.99 Trendline support drawn from the Apr 22 ‘25 low
USDJPY is trading higher as the pair extends the recovery from the Jan 27 low. This week’s gains have resulted in a breach of resistance around the 50-day EMA, at 155.75. The break undermines the recent bear theme and highlights a stronger short-term bull cycle. Sights are on 156.64 and 157.72, Fibonacci retracement points. On the downside, a reversal would expose the key support at 152.10, the Jan 27 low.
EURJPY TECHS: Recovery Extends
- RES 4: 188.65 3.236 proj of the Oct 17 - Oct 30 - Nov 5 price swing
- RES 3: 188.30 Bull channel top drawn from the Feb 28 ‘25 low
- RES 2: 186.87 High Jan 23 and the bull trigger
- RES 1: 185.12 Intraday high
- PRICE: 185.07 @ 07:59 GMT Feb 4
- SUP 1: 181.79 Low Jan 26
- SUP 2: 181.57 Low Dec 17
- SUP 3: 180.50 Low Dec 8
- SUP 4: 180.27 Base of a bull channel drawn from the Feb 28 ‘25 low
EURJPY is trading higher as the cross recovers from the Jan 26 low. A continuation would suggest the end of the recent corrective pullback and refocus attention on 186.87, the Jan 23 high and the bull trigger. Clearance of this hurdle would confirm a resumption of the uptrend. Support to watch lies at 181.79, the Jan 26 low. A move through this support would expose 180.27, a bull channel support drawn from the Feb 28 ‘25 low.
AUDUSD TECHS: Key S/T Resistance Intact For Now
- RES 4: 0.7208 61.8% of the Feb 25 ‘21 - Apr 9 ‘25 bear leg
- RES 3: 0.7158 High Feb 2 2023
- RES 2: 0.7123 2.000 proj of the Nov 21 - Dec 10 - 18 price swing
- RES 1: 0.7094 High Jan 29 ,and the bull trigger
- PRICE: 0.7036 @ 08:06 GMT Feb 4
- SUP 1: 0.6909 Low Feb 2
- SUP 2: 0.6862 20-day EMA
- SUP 3: 0.6747 50-day EMA
- SUP 4: 0.6660 Low Dec 31
A bull cycle in AUDUSD remains in play and recent gains reinforce current trend conditions. However, the pullback between Jan 29 - Feb 2 continues to highlight a corrective phase. If correct, it suggests potential for an extension towards support around the 20-day EMA, at 0.6862. This would also confirm an unwinding of the recent overbought trend condition. Key short-term resistance and the bull trigger to watch is 0.7094, the Jan 29 high.
USDCAD TECHS: Unwinding A Recent Oversold Condition
- RES 4: 1.3929 High Jan 16 and a reversal trigger
- RES 3: 1.3879 High Jan 20
- RES 2: 1.3788 50-day EMA
- RES 1: 1.3715 20-day EMA
- PRICE: 1.3631 @ 08:09 GMT Feb 4
- SUP 1: 1.3482 Low Jan 30 and the bear trigger
- SUP 2: 1.3473 Low Oct 2 ‘24
- SUP 3: 1.3400 50.0% retracement of the 2021 - 2025 uptrend
- SUP 4: 1.3359 Low Jan 31 2024
The strong recovery from last Friday’s low in USDCAD continues to highlight a corrective cycle. Note that the trend has been in oversold territory and the bounce is allowing this condition to unwind. The next important resistance to watch is 1.3715, the 20-day EMA. Resistance at the 50-day EMA, is at 1.3788. Key support and the bear trigger has been defined at 1.3482, the Jan 30 low. A break of this level would confirm a resumption of the downtrend.
FIXED INCOME
BUND TECHS: (H6) Bearish Outlook
- RES 4: 129.24 High Dec 1
- RES 3: 128.89 61.8% retracement of the Nov 26 - Dec 22 bear leg
- RES 2: 128.75 High Dec 3
- RES 1: 128.40/58 High Jan 29 / 19 and key short-term resistance
- PRICE: 127.81 @ 05:39 GMT Feb 4
- SUP 1: 127.51 Low Jan 23
- SUP 2: 127.13/126.75 Low Jan 6 / Low Dec 22 and the bear trigger
- SUP 3: 126.53 Low Mar 11 (cont.) and a key support
- SUP 4: 126.35 3.236 projection of the Nov 12 - 20 - 26 price swing
The trend outlook in Bund futures remains bearish and recent gains appear to have been a correction plus this week’s move down reinforces a bearish theme. Attention is on support at 127.51, the Jan 23 low, where a break would strengthen the bear theme and open 127.13 next, the Jan 6 low. Key short-term resistance to watch is 128.58, the Jan 19 high. For bulls, a breach of this hurdle would reinstate the recent uptrend.
BOBL TECHS: (H6) Bear Threat Remains Present
- RES 4: 116.960 High Dec 1
- RES 3: 116.805 76.4% retracement of the Nov 26 - Dec 10 bear leg
- RES 2: 116.720 High Dec 4
- RES 1: 116.690 High Feb 2
- PRICE: 116.420 @ 05:48 GMT Feb 4
- SUP 1: 116.290/140 Low Feb 3 / Low Jan 23 and key S/T support
- SUP 2: 115.920 Low Jan 5
- SUP 3: 115.780 Low Dec 22
- SUP 4: 115.720 Low Dec 10 and the bear trigger
The recent rally in Bobl futures appears to have been a correction. The trend outlook remains bearish - moving average studies are in a bear-mode position highlighting a dominant downtrend. Key short-term support has been defined at 116.140, the Jan 23 low. Clearance of this level would reinstate a bear cycle. Resistance to watch is at 116.690, the Feb 2 high. A clear breach of this level would undermine the bear theme.
SCHATZ TECHS: (H6) Resistance Remains Intact
- RES 4: 107.000 Round number resistance
- RES 3: 106.959 76.4% retracement of the Nov 21 - Dec 10 bear leg
- RES 2: 106.945 High Dec 3
- RES 1: 106.935 High Jan 21 / 29 and the bull trigger
- PRICE: 106.850 @ 06:21 GMT Feb 4
- SUP 1: 106.760 Low Jan 23 and a key short-term support
- SUP 2: 106.725 Low Jan 5
- SUP 3: 106.690 Low Dec 18 & 22
- SUP 4: 106.630 Low Dec 10 and the bear trigger
A dominant bear theme in Schatz futures remains intact and recent gains are considered corrective. Sights are the initial key support at 106.760, the Jan 23 low. A break of this level would pave the way for a bearish extension towards 106.725, the Jan 5 low. Key short-term resistance and the bull trigger to watch has been defined at 106.935, the Jan 21 and 29 high. A clear breach of it would be a bullish development.
GILT TECHS: (H6) Bearish Cycle
- RES 4: 92.95 High Jan and a key resistance
- RES 3: 92.51 High Jan 19
- RES 2: 92.13 High Jan 22
- RES 1: 91.35 20-day EMA
- PRICE: 90.93 @ Close Feb 3
- SUP 1: 90.48 Low Jan 29
- SUP 2: 90.00 Round number support
- SUP 3: 89.86 Low Nov 19 2025 and a key support
- SUP 4: 89.52 1.500 proj of the Jan 14 - 20 - 22 price swing
A bearish theme in Gilt futures remains intact. Recent weakness has resulted in a break of the 20-day EMA. Note too that price is trading below 91.31, a trendline support drawn from the Nov 19 low. The breach of the trendline undermines the recent bull theme and highlights potential for a deeper retracement with sights on the 90.00 handle next. Initial resistance is at 91.35, the 20-day EMA.
BTP TECHS: (H6) Monitoring Trendline Support
- RES 4: 121.87 2.000 proj of the Dec 10 - 17 - 22 price swing
- RES 3: 121.58 1.764 proj of the Dec 10 - 17 - 22 price swing
- RES 2: 121.37 High Nov 13
- RES 1: 121.31 High Jan 30
- PRICE: 120.80 @ Close Feb 3
- SUP 1: 120.42 Trendline drawn from the Dec 10 low
- SUP 2: 119.45 Low Dec 22
- SUP 3: 119.13 Low Dec 10 and the bear trigger
- SUP 4: 118.00 Round number support
A bullish theme in BTP futures remains intact and short-term pullbacks are for now, considered corrective. Resistance to watch is 121.37, the Nov 13 high, exposed. Clearance of it would strengthen the bullish theme. On the downside, a continuation lower would expose 120.42, a short-term trendline support drawn from the Dec 10 low. Clearance of this trendline would undermine the bull theme and signal scope for a deeper retracement.
EQUITIES
EUROSTOXX50 TECHS: (H6) Pierces The Bull Trigger
- RES 4: 6134.00 1.382 proj of the Nov 21 - Dec 12 - 18 price swing
- RES 3: 6100.00 Round number resistance
- RES 2: 6086.99 1.236 proj of the Nov 21 - Dec 12 - 18 price swing
- RES 1: 6086.00 High Jan 3
- PRICE: 6002.00 @ 06:42 GMT Feb 4
- SUP 1: 5863.24 50-day EMA
- SUP 2: 5838.00 Low Jan 20 and a bear trigger
- SUP 3: 5750.00 Low Dec 23
- SUP 4: 5689.00 Low Dec 18
A bull cycle in EUROSTOXX 50 futures remains intact and this week’s gains reinforce this theme. Key support lies at the 50-day EMA at 5863.24. A clear breach of this average would signal scope for a deeper retracement. Moving average studies are in a bull-mode position, highlighting a dominant uptrend. The bull trigger at 6072.00, the Jan 14 / 15 high, has been pierced. A clear break would resume the primary uptrend.
E-MINI S&P: (H6) Trend Needle Points North
- RES 4: 7141.7 1.236 proj of the Dec 18 - Jan 13 - 21 price swing
- RES 3: 7100.00 Round number resistance
- RES 2: 7080.92 0.764 proj of the Nov 21 - Dec 11 - 18 price swing
- RES 1: 7043.00 High Jan 28 and bull trigger
- PRICE: 6958.50 @ 07:21 GMT Feb 4
- SUP 1: 6864.50 Low Feb 2
- SUP 2: 6814.50 Low Jan 21 and the bear trigger
- SUP 3: 6771.50 Low Dec 18 and a key support
- SUP 4: 6684.50 Low Nov 24
The trend in S&P E-Minis remains bullish. The recovery from Monday’s low suggests that a recent bear threat merely resulted in a short lived correction. Attention is on key resistance and the bull trigger at 7043.00, the Jan 28 high. A break of this level would confirm a resumption of the primary uptrend and open 7080.92, a Fibonacci projection. Key support and a bear trigger has been defined at 6814.50, the Jan 21 low.
COMMODITIES
BRENT TECHS: (J6) Corrective Phase
- RES 4: $75.93 - 2.00 proj of the Jan 5 - 14 - 19 price swing
- RES 3: $73.33 - High Jun 23 ‘25 and a key M/T resistance
- RES 2: $72.00 - Round number resistance
- RES 1: $68.83/70.58 - High Feb 2 / High Jan 29 and the bull trigger
- PRICE: $67.77 @ 07:05 GMT Feb 4
- SUP 1: $65.22 - 20-day EMA
- SUP 2: $63.70 - 50-day EMA
- SUP 3: $62.59 - Low Jan 19
- SUP 4: $59.44 - Low Jan 5
A bull theme in Brent futures remains intact, however, the sharp reversal from last week’s high highlights - for now - the start of a corrective cycle. Support to watch lies at $65.22, the 20-day EMA. Support the 50-day EMA, is at $63.70. The area between these two averages represents a key support zone. A clear breach of the 50-day average would signal scope for a deeper retracement. Key resistance has been defined at $70.58, the Jan 29 high.
WTI TECHS: (H6) Bearish Corrective Phase
- RES 4: $71.66 - 2.00 proj of the Jan 7 - 14 - 20 price swing
- RES 3: $69.80 - High Jun 23 ‘25 and a key medium-term resistance
- RES 2: $68.00 - Round number resistance
- RES 1: $66.48 - High Jan 30
- PRICE: $63.59 @ 07:17 GMT Feb 4
- SUP 1: $61.22/59.88 - 20- and 50-day EMA values
- SUP 2: $58.53 - Low Jan 20
- SUP 3: $55.65 - Low Ja 7
- SUP 4: $54.56 - Low Apr 9 ‘25 and a key support
A bull cycle in WTI futures remains intact. However, Monday’s impulsive sell-off continues to highlight the beginning of a corrective phase. Attention is on support at the 20-day EMA, at $61.22. The 50-day EMA lies at $59.88. A clear breach of the 50-day average would highlight a stronger reversal and open $58.53, the Jan 20 low. Key resistance and the bull trigger has been defined at $66.48, the Jan 30 high.
GOLD TECHS: Retracement Mode
- RES 4: $5451.0 - High Jan 30
- RES 3: $5314.0 - 76.4% retracement of the Jan 29 - Feb 2 pullback
- RES 2: $5139.9 - 61.8%retracement of the Jan 29 - Feb 2 pullback
- RES 1: $5090.3 - Intraday high
- PRICE: $5082.2 @ 07:25 GMT Feb 4
- SUP 1: $4661.0 - Low Feb 3
- SUP 2: $4403.0 - Low Feb 2
- SUP 3: $4274.7 - Low Dec 31 ‘25 and a key support
- SUP 4: $4170.3 - Low Dec 9
Gold has recovered from Monday’s low and is retracing the Jan 29 - Feb 2 sharp sell-off. The next two resistance points to monitor are $5139.9 and $5314.0, Fibonacci retracement levels. Note that the sharp sell-off from last week’s high still highlights a potential top in the L/T trend and from a S/T perspective, marks an unwinding of the recent extreme overbought condition. A reversal lower would refocus attention on $4403.0, the Feb 2 low.
SILVER TECHS: Reversal Continues To Highlights A Top
- RES 4: $121.654 - High Jan 30 and key resistance
- RES 3: $106.895 - Low Jan 29
- RES 2: $100.000 - Round number resistance
- RES 1: $91.775 - 20-day EMA
- PRICE: $90.428 @ 08:13 GMT Feb 4
- SUP 1: $71.382 - Low Feb 2
- SUP 2: $70.071 - Low Dec 31
- SUP 3: $64.493 - Low Dec 19
- SUP 4: $60.815 - Low Dec 12
The strong reversal in Silver from last week’s high confirms a top in the long-term trend - for now - and from a short-term perspective, highlights an unwinding of the recent extreme overbought condition. The metal has traded through both the 20- and 50-day EMAs. This signals scope for a deeper retracement and opens $70.071, the Dec 31 ‘25 low. Initial firm resistance is at 91.775, the 20-day EMA.