NORWAY: Mainland Investment Drives Q2 Beat; Hawkish Signals For Norges
The Q2 mainland GDP beat (0.6% Q/Q vs 0.3% Norges Bank and consensus) was driven by higher-than-expected business and residential investment. Notably, Q2 mainland GDP growth was 0.9% Q/Q when excluding volatile industries like fishing and electric power growth. This adds to the hawkish message from the print in our view. Alongside this GDP report, the Q3 Regional Network Survey will be key in determining what contribution domestic demand makes to the September MPR rate path projection. NOK weakness has extended since the report was published, with EURNOK now 0.25% lower on the session. Q1’s mainland GDP reading was also revised up to 1.2% Q/Q (vs 1.0% initial).
- Household consumption rose 0.2% Q/Q, a step down from last quarter’s 1.7% Q/Q and below Norges Bank’s 0.5% projection. This was driven by goods consumption (1.9% Q/Q, partly a function of new car purchases), consistent with solid retail sales momentum through Q2. Services consumption fell 0.1% Q/Q.
- Mainland gross fixed capital formation rose 2.1% Q/Q (vs -2.2% prior), with residential investment rebounding 4.0% Q/Q, well above Norges Bank’s 0.5% projection and last quarter’s -6.0%. Business/industry investment was also solid at 2.2% Q/Q (vs -0.7% prior, -3.4% Norges Bank).
- Government spending (consumption + investment) was weaker than Norges Bank projected at 0.5% Q/Q (vs 1.7% Norges).
- Within the mainland external sector, goods exports rose 4.2% Q/Q (vs -0.3% prior) but this was offset by a 6.4% Q/Q fall in services exports. Similar dynamics were seen in imports, with goods rising 1.2% Q/Q but services falling 4.5%.
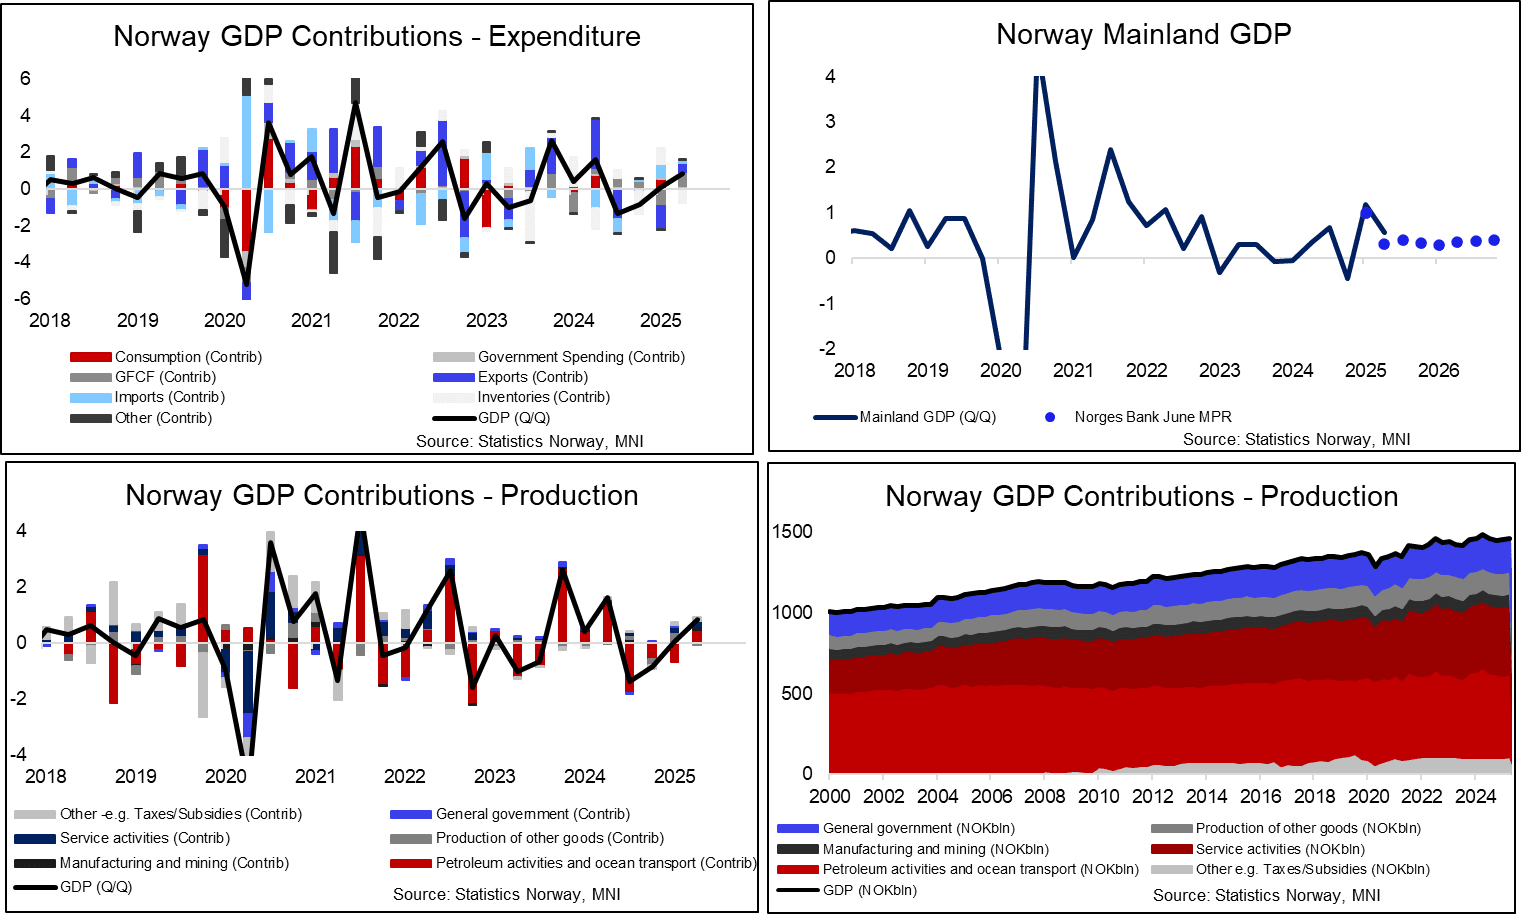
- Headline GDP rose 0.8% Q/Q, with last quarter’s reading also revised up to 0.1% (vs -0.1% initial). Petroleum investment rebounded 12.1% Q/Q (vs 11.6% Norges Bank, -8.7% prior). Oil/gas exports rose 2.1% Q/Q. Inventories notably pulled headline GDP down by 0.7pp.
- From a production perspective, Statistics Norway highlights that Q2 mainland growth was “particularly driven by increased gross product in manufacturing, retail trade and fishing, trapping and aquaculture, offset somewhat by “ by a drop in electricity, gas and hot water supply”.
- “Excluding traditional fishing and electric power, growth in mainland GDP would have been 0.9 percent in the second quarter and 1.0 percent in the first quarter of 2025.”
Want to read more?
Find more articles and bullets on these widgets:
Historical bullets
EQUITY TECHS: E-MINI S&P: (U5) Fresh Cycle High
- RES 4: 6439.884 1.500 proj of the May 23 - Jun 11 - 23 price swing
- RES 3: 6402.44 1.382 proj of the May 23 - Jun 11 - 23 price swing
- RES 2: 6381.50 1.764 proj of the Apr 7 - 10 - 21 price swing
- RES 1: 6374.00 High Jul 21
- PRICE: 6342.00 @ 07:23 BST Jul 22
- SUP 1: 6288.25 Low Jul 17
- SUP 2: 6256.07/6111.35 20- and 50-day EMA values
- SUP 3: 5811.50 Low May 23
- SUP 4: 5645.75 Low May 7
S&P E-Minis traded to a fresh cycle high Monday before pulling back. The climb confirms a resumption of the uptrend and maintains the price sequence of higher highs and higher lows. Note that moving average studies are in a bull-mode position highlighting a clear dominant uptrend. Sights are on 6381.50, a Fibonacci projection. Key support is at the 50-day EMA, at 6111.35. Support at the 20-day EMA is at 6256.07.
WTI TECHS: (Q5) Trend Signals Continue To Point South
- RES 4: $82.62 - 3.000 proj of the Apr 9 - 23 - May 5 price swing
- RES 3: $80.43 - 2.764 proj of the Apr 9 - 23 - May 5 price swing
- RES 2: $80.00 - Psychological round number
- RES 1: $71.20/78.40 - 50.0% of the Jun 23-24 range / High Jun 23
- PRICE: $66.60 @ 06:27 BST Jul 22
- SUP 1: $65.68/64.00 - 50-day EMA / Low Jun 24
- SUP 2: $58.87 - Low May 30
- SUP 3: $54.81 - Low May 5
- SUP 4: $54.13 - Low Apr 9 and a key support
A bearish theme in WTI futures remains intact and the recovery since Jun 24 still appears corrective. The sharp reversal from the Jun 23 high continues to highlight scope for an extension lower. Support to watch is the 50-day EMA, at $65.74. The average has been pierced, a clear break of it would expose $58.87, the May 30 low. Initial resistance to monitor is $71.20, the 50.0% retracement of the Jun 23 - 24 high-low range.
GOLD TECHS: Recovery Extends
- RES 4: $3547.9 - 1.764 proj of the Feb 28 - Apr 3 - Apr 7 price swing
- RES 3: $3500.1 - High Apr 22 and bull trigger
- RES 2: $3451.3 - High Jun 16
- RES 1: $3402.8 - High Jul 21
- PRICE: 3385.3 @ 07:25 BST Jul 22
- SUP 1: $3342.3 - 20-day EMA
- SUP 2: $3282.8/3248.7 - Low Jul 9 / Low Jun 30 and the bear trigger
- SUP 3: $3204.7 - Low May 20
- SUP 4: $3121.0 - Low May 15 and key support
A bull cycle in Gold that started Jun 30 remains intact, and Monday’s bullish start to the week marks an extension of the recovery. $3395.1, the Jun 23 high, has been pierced. A continuation would open $3451.3, the Jun 16 high. Note that moving average studies are in a bull-mode position highlighting a dominant uptrend. The bear trigger is $3248.7, the Jun 30 low. An initial firm support to watch is 3282.8, the Jul 9 low.