ASIA STOCKS: Limited Offshore Inflows In Tech Plays So Far, Indian Outflows
2026 to date net inflows are positive for both South Korea and Taiwan but only marginally. Yesterday we saw solid net offshore buying of South Korean stocks, but the past 5-trading days has still seen firm net outflows. The Kospi remains on the front foot and tracking at fresh record highs. Outside of broader tech related trends, some focus will rest on potential efforts to encourage local retail investors to invest more into local stocks (as a way to stem won FX weakness), while BoK Governor Rhee stated yesterday the National Pension Service needs to review its local stock allocation (also viewed as part of the effort to help the weak won). If these moves gain traction the Kospi could see further support, which may attract offshore inflows.
- For Taiwan, we saw modest net outflows yesterday, but prior sessions saw decent net inflows. Yesterday's strong Q4 TSMC results, including the strong outlook for 2026 capex and sales, bodes well for the broader AI/chip backdrop. The US-Taiwan trade deal is another potential positive, although arguably didn't deliver high level surprises, as Taiwan obtained a 15% tariff rate through investment pledges to the US (similar to what South Korea and Japan negotiated).
- Elsewhere, Indian outflows have been a feature so far in 2026. This matches with a relatively soft start for Indian aggregate equity indices since the start of the year. Uncertainty around US-India trade continues.
- In South East Asia, Indonesia and Malaysia remain the positive standouts.
Table 1: Asian Markets Net Equity Flows
| Yesterday | Past 5 Trading Days | 2026 To Date | |
| South Korea (USDmn) | 449 | -1761 | 429 |
| Taiwan (USDmn) | -57 | 716 | 666 |
| India (USDmn)* | -48 | -1418 | -1605 |
| Indonesia (USDmn) | 56 | 264 | 434 |
| Thailand (USDmn) | 84 | 81 | -19 |
| Malaysia (USDmn) | 81 | 195 | 20 |
| Philippines (USDmn) | 22 | 50 | 88 |
| Total (USDmn) | 587 | -1874 | 13 |
| * Data Up To Jan 13 |
Source: Bloomberg Finance L.P./MNI
Want to read more?
Find more articles and bullets on these widgets:
Historical bullets
US TSY FLOWS: BLOCK SELL TYH6
SELL 2945 of TYH6 traded at 112-15, post-time 11:40:25 AEST (DV01 $198,001). The contract closed at 112-16, -0-00+ from closing levels.
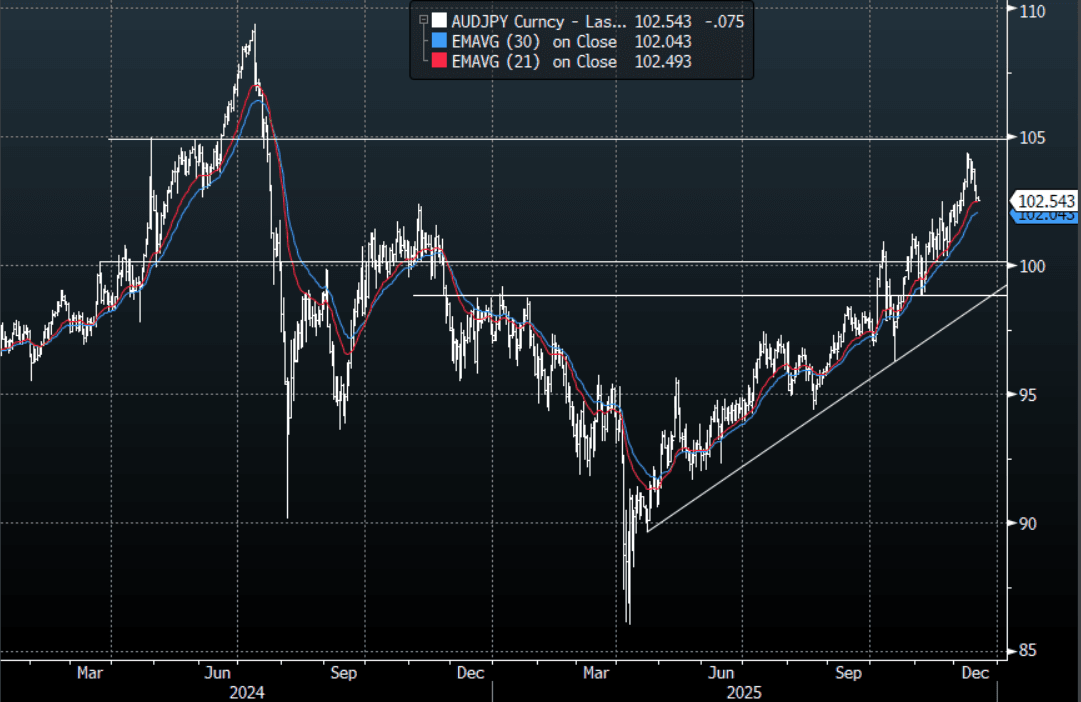
AUD: AUD/JPY - Holds Below 103.00 As Risk Turns Lower In Asia
The overnight range was 102.45 - 103.04, Asia is currently trading around 102.60. The pair has held below the 102.90-103.00 area which it broke through yesterday. Risk has taken a leg lower in Asia on the Venezuelan news as a short oil market gaps 1% higher. On the day look for sellers to be around the 103.00-103.30 area, if price remains capped below here it implies there could be a deeper pullback towards the 101.50-102.00 support area.
- The AUD/JPY Average True Range(ATR) for the last 10 Trading days: 68 Points
Fig 1: AUD/JPY spot Daily Chart
Source: MNI - Market News/Bloomberg Finance L.P
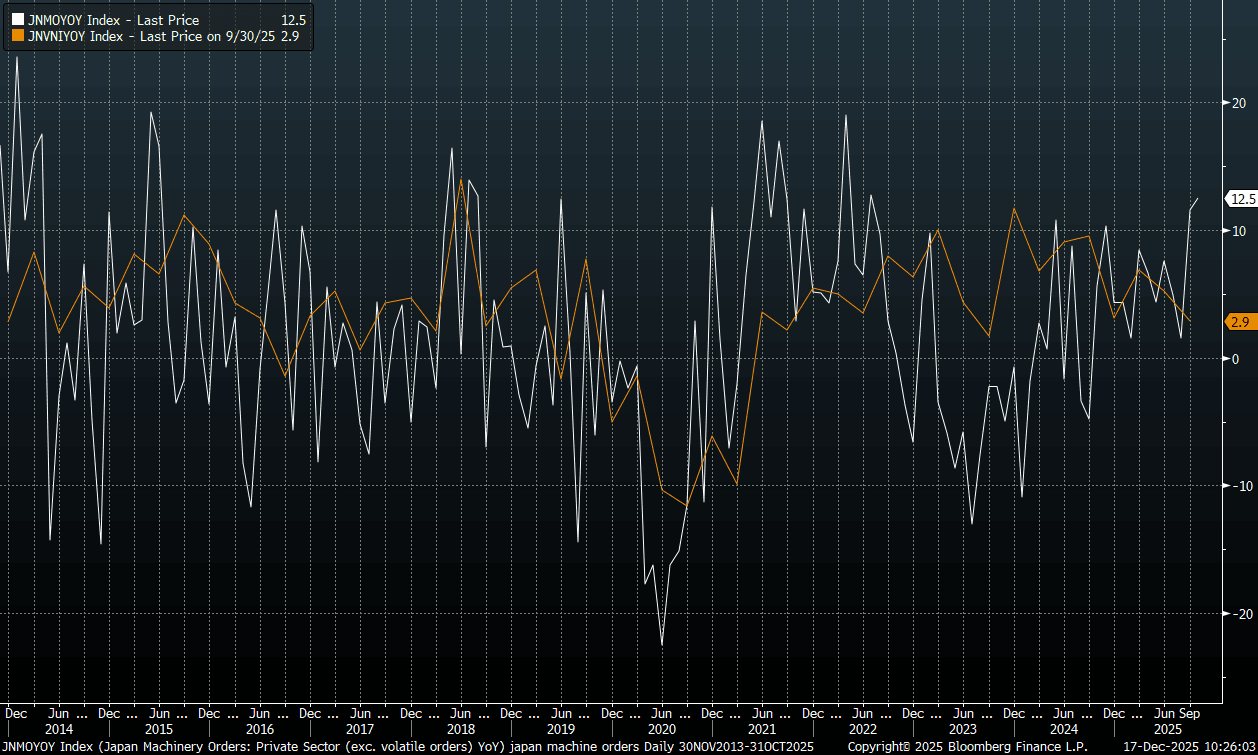
JAPAN DATA: Machine Orders Well Above Forecasts, Bodes Well For Capex Spend
Japan core machine orders for Oct were notably above forecasts. In m/m terms we rose 7.0%, against a -1.8% forecast, while y/y we rose 12.5%, versus a 3.6% forecast. This leaves the y/y pace at fresh highs back to 2022. The chart below plots the machine order print against capex y/y (ex software). The positive trend for machine orders bodes well for the capex outlook. Business/capex spending has been an important source of growth for Japan, although we saw a dip in Q3.
Fig 1: Japan Core Machine Orders & Capex Y/Y (Ex Software)
Source: Bloomberg Finance L.P./MNI