US DATA: LEI Continues To Stagnate, Pointing To Soft Manufacturing
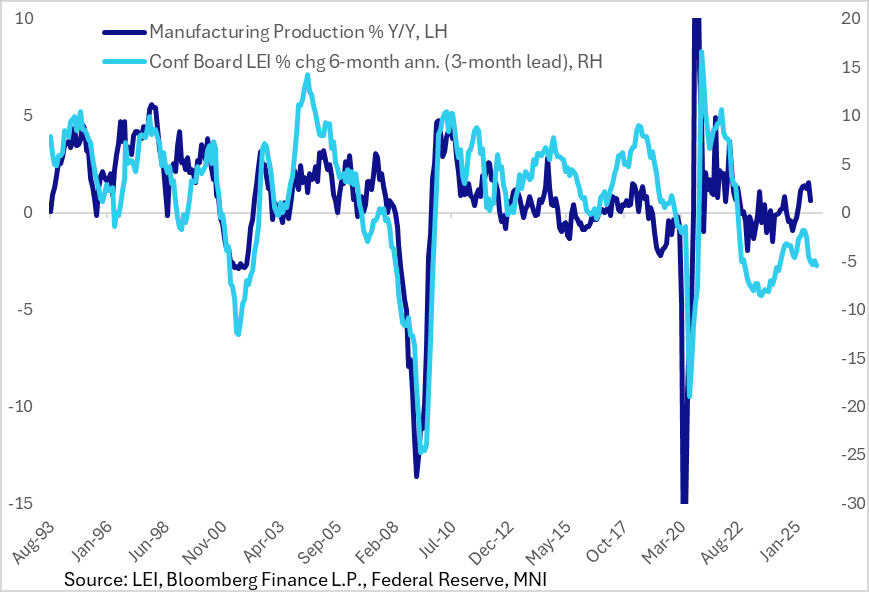
The Conference Board's US Leading Economic Index (LEI) fell 0.5% M/M in August, worse than the -0.2% expected but offset by an upward revision to July to +0.1% from -0.1%.
- The upward July revision marked the first positive reading in the index since November 2024 (and prior to that, February 2024). That compares to positive GDP growth throughout the period (with the exception of the trade/inventory related volatility of H1 2025), underlining that the LEI hasn't been particularly useful in recent years in tracking let alone predicting economic activity.
- As we continue to note, the LEI's composition makes it more of an index of manufacturing and, to a lesser extent, financial conditions. As such they captured the contraction in manufacturing construction fairly well for most of 2022-24, and peaked around the same time as manufacturing activity seems to have rebounded (amid tariff-front-running).
- The latest LEI contraction was the biggest since April, largely due to a fall in average weekly hours, weaker ISM new orders, softer consumer expectations, and weaker building permits.
- The lack of upside impetus suggests that there is little upside momentum for industrial growth over the rest of the year.
Want to read more?
Find more articles and bullets on these widgets:
Historical bullets
CANADA DATA: Inflation Breadth Narrows Slightly In July Report
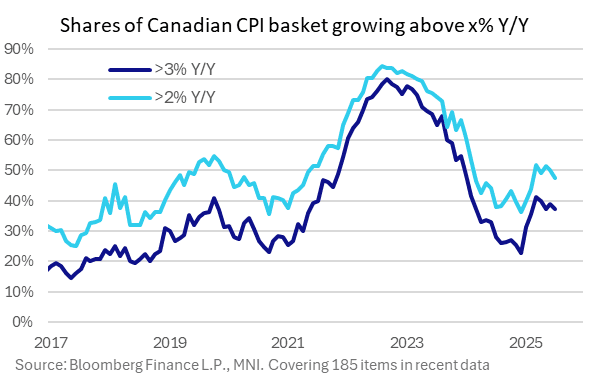
MNI's estimates of inflationary "breadth" showed narrower price pressures in the July Canada CPI report.
- The percentage of CPI categories rising by more than 2% (looking at 185 CPI basket items) fell to 47.6% from 50.3% prior, for the narrowest since February.
- The % above 3% fell back to May's level, at 37.3%, from 38.9% prior. The proportion rising by more than 4% however remained unchanged at 30.3%.
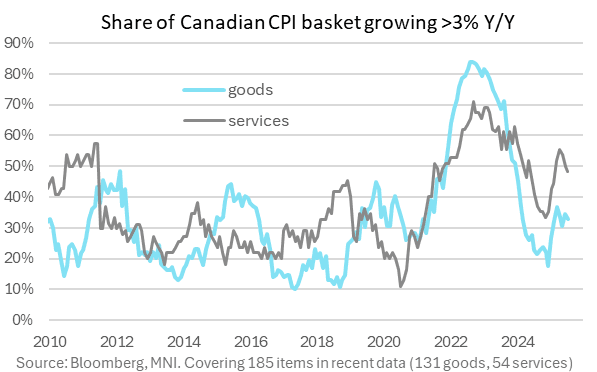
- Both goods and services breadth narrowed, with goods rising 2+% at 30.3% (31.4% prior, 3-month low) and services 17.3% (18.9% prior, 5-month low).
- Traditionally, the >3% breadth metric has been most closely tracked by the BOC in terms of gauging broad inflation pressures, and while this remains uncomfortably high it appears to be on the way down.
US TSYS: Early Support From Soft US Build Permits & Canadian CPI Data
- Treasuries look to finish near late Tuesday session highs (TYU5 +8.5 at 111-25), curves bull flattening with bonds outperforming (2s10s -2.245 at 54.607, 5s30s -.571 at 107.952).
- Rates rebounded after this morning's data - lower than expected build permits outweighing higher than expected housing starts, while softer Canadian CPI aggregates added to support.
- Housing starts were far stronger than expected in July at 1428k (saar, cons 1297k) after an upward revised 1358k (initial 1321k) in June. It left starts rising 5.2% M/M (cons -1.8%) after a stronger than first thought 5.9% (initial 4.6%) as they bounced after a -8.3% M/M decline in May (also revised from -9.7%).
- Canadian all-items CPI rose 1.73% Y/Y unrounded (1.86% prior, 1.8% expected by MNI median), and 0.12% M/M (0.18% prior, 0.4% expected).
- US$ rising to one week highs, price action was assisted by a dip lower for the major equity benchmarks, as a cautious risk off mood prevails given the lack of progress regarding a Russia/Ukraine ceasefire and the notable weakness for tech stocks in the US.
- Stocks in retreat (Nasdaq -323.04 at 21306.66) ahead of Wednesday's July FOMC minutes not to mention Friday's annual economic symposium in Jackson Hole Wyoming.
AUDUSD TECHS: Trend Signals Remain Bullish
- RES 4: 0.6700 76.4% retracement of the Sep 30 ‘24 - Apr 9 bear leg
- RES 3: 0.6688 High Nov 7 ‘24
- RES 2: 0.6677 0.764 proj of the Jun 23 - Jul 11 - 17 price swing
- RES 1: 0.6569/6625 High Aug 14 / 24 and the bull trigger
- PRICE: 0.6461 @ 16:32 BST Aug 19
- SUP 1: 0.6419 Low Aug 1 and a bear trigger
- SUP 2: 0.6373 Low Jun 23
- SUP 3: 0.6354 38.2% retracement of the Apr 9 - Jul 24 upleg
- SUP 4: 0.6323 Low Apr 16
AUDUSD is off its most recent highs but continues to trade in a range. From a trend perspective, the condition remains bullish highlighted by MA studies that remain in a bull-mode position. Key resistance to monitor, has been defined at 0.6625, the Jul 24 high. Clearance of this level would confirm a resumption of the uptrend and open 0.6677, a Fibonacci projection. On the downside, key support to watch lies at 0.6419, the Aug 1 low.