US TSYS: Late SOFR/Treasury Option Roundup: Seeking Cheaper Puts
SOFR & Treasury option flow revolved around better downside puts on net Thursday - fading higher und...
Want to read more?
Find more articles and bullets on these widgets:
Historical bullets
EURJPY TECHS: Trend Needle Points North
- RES 4: 186.41 2.618 proj of the Jul 31 - Sep 29 - Oct 2 price swing
- RES 3: 186.20 Bull channel top drawn from the Feb 28 low
- RES 2: 185.77 2.5000 proj of the Jul 31 - Sep 29 - Oct 2 price swing
- RES 1: 184.92 High Dec 22
- PRICE: 183.15 @ 16:28 GMT Jan 6
- SUP 1: 183.18/182.82 20-day EMA / Low Jan 6
- SUP 2: 182.25 Low Dec 19
- SUP 3: 181.57 Low Dec 17
- SUP 4: 181.17 50-day EMA
The trend structure in EURJPY remains bullish and the cross continues to trade closer to its recent highs. A fresh trend high on Dec 22 confirms a resumption of the primary uptrend. Sights are on 186.10, the top of a bull channel drawn from the Feb 28 low. This level also represents a key resistance point. Support to watch lies at 183.18, the 20-day EMA (pierced). A breach of it would signal the start of a corrective cycle.
PIPELINE: Corporate Bond Update: $56.25B Total to Price, Third Largest on Record
$56.25B to Price Tuesday after $57.85B priced Monday, $114.1B total so far. Not unusual to see the backlog of borrowers after the holidays, as well as getting ahead of earnings blackout. The next earnings cycle kicks off in earnest next week with Bank of NY Mellon, JPM reporting on Tuesday January 13, Bank of America, Wells Fargo and Citigroup on Wednesday, Goldman Sachs, Blackrock and Morgan Stanley on Thursday.
- Date $MM Issuer (Priced *, Launch #)
- 01/06 $6B #Orange $750M 3Y +50, $1.25B 5Y +70, $1.5B 7Y +85, $2B 10Y +95, $500M 30Y +100
- 01/06 $6B #Israel $2.25B 5Y +90, $2B 10Y +100, $1.75B 30Y +125
- 01/06 $6B *EIB 5Y SOFR+32
- 01/06 $4.5B #Broadcom $750M 5Y +60, $1.25B 7Y +70, $1.25B 10Y +78, $1.25B 30Y +88
- 01/06 $3.5B *ADB 10Y SOFR+45
- 01/06 $3.5B #TotalEnergies Capital $1.5B 5Y +53, $1.25B 7Y +63, $750M 10Y +68
- 01/06 $3.5B #Kexim $1.25B 3Y +23, $500M 3Y SOFR+40, $1.25B 5Y +26, $500M 10Y +30
- 01/06 $3.3B #BPCE $1B 6NC5 +105, $1.5B 11NC10 +125, $800M 21NC20 +155
- 01/06 $2.5B #Standard Chartered $1B 4NC3 +77, $500M 4NC3 SOFR+92, $1B 11NC10 +107
- 01/06 $2.5B #TD Bank $1B 2Y +45, $600M 2Y SOFR+58, $900M 5Y +70 (drops 5Y SOFR leg)
- 01/06 $2.5B #Nat'l Bank of Australia $650M 3Y +35, $600M 3Y SOFR+53, $500M 5Y +45, $750M 5Y SOFR+68
- 01/06 $2B #American Honda $700M 3Y +62, $30M 3Y SOFR+78, $500M 5Y +77, $500M 10Y +95
- 01/06 $1.75B Charter Communications 7Y, 10Y guidance TBA
- 01/06 $1.75B #AERCAP $900M 3Y +70, $850M 7Y +92
- 01/06 $800M #Simon Property 5Y +65
- 01/06 $750M #HPS Corp $350M +3Y +170, $400M +5Y +200
- 01/06 $750M *F&G Global Funding 3Y +97
- 01/06 $700M *Principle Life 5Y +75
- 01/06 $700M #CIBC 60.5NC5.5 6.5%
- 01/06 $650M #Corebridge Global 5Y +85
- 01/06 $600M #Northwestern Mutual 5Y +58
- 01/06 $500M Mitsubishi HC Finance AM 5Y +85
- 01/06 $500M *DBJ 10Y SOFR+61
- 01/06 $500M #Penske Trucking 5Y +85
- 01/06 $500M #CNH Industrial +5Y +85
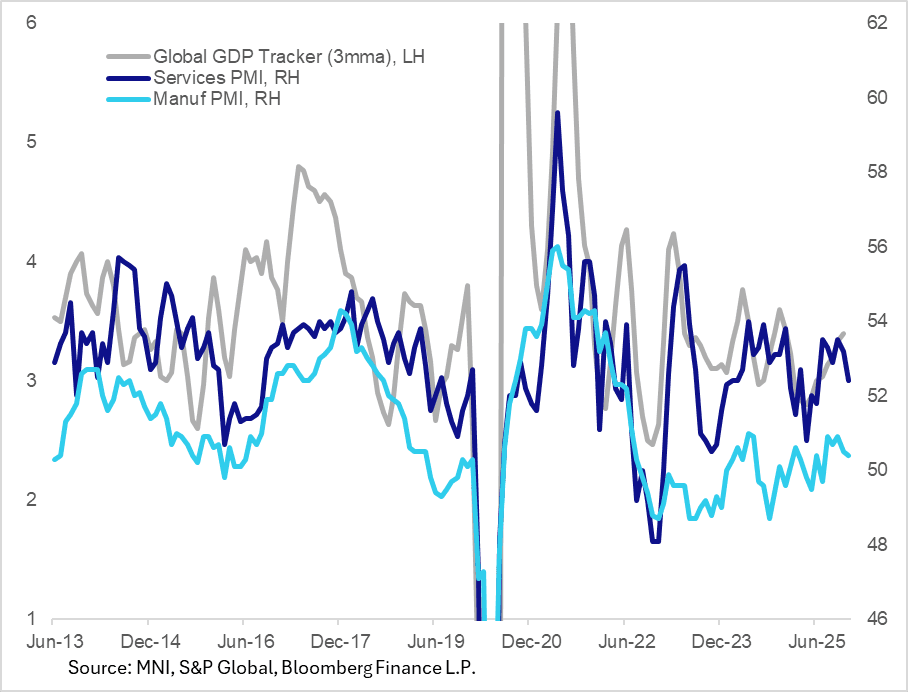
GLOBAL MACRO: Global PMIs Point To Limited Upside GDP Momentum At End-2025
The JPMorgan Global Composite PMI for December showed a slight slowdown in activity (to a 6-month low 52.0 after 52.7 in Nov) but confirming a 50+ reading for a 35th consecutive month. Overall global GDP continues to track a little north of the 3% mark as we end the year, though December's softer PMIs are suggestive of limited upward momentum,
- Services PMI dipped to the weakest since June in December at 52.4 (53.2), whereas manufacturing was relatively steady (50.4 after 50.5 Nov) but still posted the lowest reading since July.
- Even so, Services industries were clearly outperforming their Manufacturing counterparts per the report: "All six of the sub-sectors covered by the survey saw output increase during December, with the three services-focused categories (business, consumer and financial) all outperforming their manufacturing counterparts (consumer, intermediate and investment goods)".
- 11 of 14 countries included in the Composite saw output expansion, led by India, Spain, and Ireland; conversely China, the Eurozone, Japan, Australia and the UK were below the global average. Canada was the only country to show contraction, with France, Italy and Russia relatively flat. The US and Brazil showed slightly above-global-average growth.
- Softer demand and trade barriers were obstacles to growth. New orders posted a 6-month low; new export orders saw an 8th contraction in 9 months.
- Employment was flat, while price pressures "saw a mild acceleration" though were more acute for services firms than they were for manufacturers.