EM LATAM CREDIT: LATAM Credit Market Wrap
Source: Bloomberg Finance L.P.
Measure Level Δ DoD
5yr UST 3.82% +5bp
10yr UST 4.22% +6bp
5s-10s UST 40.3 +0bp
WTI Crude 59.5 +0.3
Gold 4589 -27.6
Bonds (CBBT) Z-Sprd Δ DoD
ARGENT 3 1/2 07/09/41 740bp -1bp
BRAZIL 6 1/8 03/15/34 220bp -1bp
BRAZIL 7 1/8 05/13/54 303bp -1bp
COLOM 8 11/14/35 305bp -5bp
COLOM 8 3/8 11/07/54 359bp -3bp
ELSALV 7.65 06/15/35 310bp -4bp
MEX 6 7/8 05/13/37 219bp -0bp
MEX 7 3/8 05/13/55 263bp +1bp
CHILE 5.65 01/13/37 105bp -2bp
PANAMA 6.4 02/14/35 191bp -4bp
CSNABZ 5 7/8 04/08/32 571bp +25bp
MRFGBZ 3.95 01/29/31 257bp -5bp
PEMEX 7.69 01/23/50 464bp -1bp
CDEL 6.33 01/13/35 163bp -2bp
SUZANO 3 1/8 01/15/32 152bp -2bp
FX Level Δ DoD
USDBRL 5.37 +0.00
USDCLP 886.51 +3.51
USDMXN 17.6 -0.02
USDCOP 3696.39 +11.79
USDPEN 3.36 -0.00
CDS Level Δ DoD
Mexico 91 2
Brazil 137 1
Colombia 202 0
Chile 41 1
CDX EM 98.79 (0.00)
CDX EM IG 101.46 (0.01)
CDX EM HY 95.69 (0.01)
Main stories recap:
· Treasury yields climbed 5bp as President Trump signaled Fed Chair nominee front-runner Kevin Hassett was less likely to be his choice which implied inflation hawk Kevin Warsh as more likely. Major US equity indexes took the news in stride, showing little change.
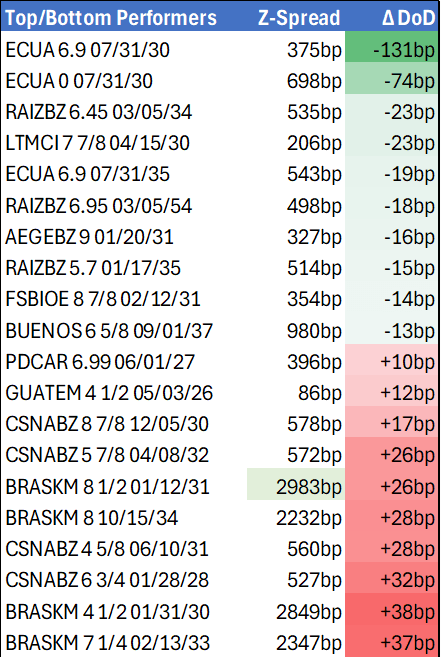
· LATAM secondary market benchmark USD bond spreads generally tightened 2-5bp. Ecuador outperformed with bonds up ½ -1 ½ points as the country announced plans for a liability management transaction designed to improved balance sheet liquidity by buying back outstanding 2030 and 2035 bonds with near term sinking fund repayments with proceeds from a new bond issuance.
· Bonds of Brazil’s CSN fell a point in profit taking after rallying as much as 4 ½ points this week on an announced plan to reduce balance sheet leverage.
Want to read more?
Find more articles and bullets on these widgets:
Historical bullets
US OUTLOOK/OPINION: Analyst Expectations Of Key Sequential Drivers For Nov CPI
Core Goods Acceleration vs Steady Core Services
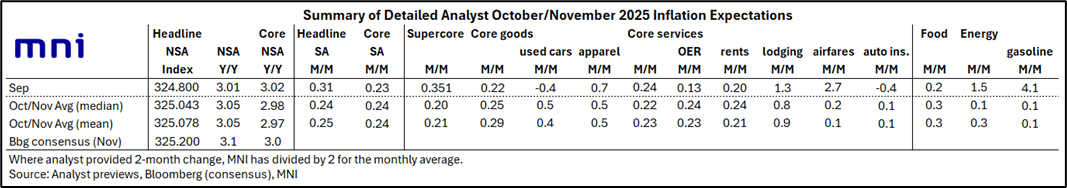
Broadly keeping to our usual format, we look at what analysts expect to see for some of the more important M/M categories or those that typically move most month-to-month. Out of necessity we have to compare expectations over two months with September’s M/M figures, even though the BLS won’t be publishing M/M figures. For clarity: where an analyst provided estimates for October and November individually, we have averaged them; where they provided a % total change over 2 months (Nov vs Sep), MNI has divided by 2 for the monthly average. In broad-brush terms, core goods inflation is expected to have firmed since September, helped by used cars, whilst core services inflation should be similar. Note also two expected sizeable contributions, to both upside and downside, from CPI-specific categories that won’t feed through to core PCE and could further distort market reaction.
- Used cars (+ve): We see an average increase of 0.4% M/M for Oct and Nov across six analysts (range -0.2% to 1.0%) after the -0.4% in September.
- Vehicle insurance* (+ve): We see an average increase of 0.1% M/M for Oct and Nov admittedly across just four analysts (range -0.1% to 0.2%) after a surprisingly weak -0.4% in September.
- Rents (+ve): OER and rent inflation is expected to have modestly accelerated after a surprisingly soft September. We see an average increase of 0.23% M/M for Oct for OER (range 0.12-0.30) in Oct and Nov after 0.13% in September, and 0.21% for rents (range 0.08-0.25) after 0.20% in September.
- Airfares* (large -ve): We see an average increase of 0.1% M/M for Oct and Nov across six analysts (range -0.7 to 1.0) after the 2.7% in September beat already high expectations of 2.0%.
- Lodging away from home (-ve): We see an average increase of 0.95% M/M for Oct and Nov across six analysts (range 0.2% to 2.0%) after a surprisingly strong 1.35% M/M in September.
- Apparel (-ve): We see an average increase of 0.5% M/M for Oct and Nov across six analysts (range 0.0% to 1.1%) after a strong 0.7% in September and 0.5% in August. A third consecutive strong month would mark a break from a pattern that has tended to oscillate from month-to-month.
* denotes a PPI-equivalent feeds into core PCE instead, with any surprises likely to be ultimately downplayed
- Non-core: Food (neutral): Seen with an average increase at a ‘low’ 0.3% M/M in Oct and Nov after 0.25% in September. As always, it’s worth watching food away from home within this after it eased to 0.14% M/M in September for its second lowest since early 2021 (an input that feeds into core PCE but not core CPI).
- Energy (-ve): Seen with a small average increase of around 0.3% M/M in Oct and Nov after a solid 1.5% in September.
AUDUSD TECHS: Corrective Pullback
- RES 4: 0.6759 High Oct 11 ‘24
- RES 3: 0.6723 High Oct 21 ‘24
- RES 2: 0.6707 High Sep 17 and a key resistance
- RES 1: 0.6686 High Dec 10
- PRICE: 0.6609 @ 16:38 GMT Dec 17
- SUP 1: 0.6595 20-day EMA
- SUP 2: 0.6562 50-day EMA
- SUP 3: 0.6517 Low Nov 27
- SUP 4: 0.6466/21 Low Nov 26 / 21
The trend condition in AUDUSD remains bullish and the latest pullback is considered corrective. A pullback is allowing this condition to unwind. First support to watch is 0.6595, the 20-day EMA. The 50-day average lies at 0.6562. The area between the two averages represents a key short-term support zone. A resumption of gains would refocus attention on key resistance at 0.6707, the Sep 17 high and bull trigger.
US TSYS: Focus on Thursday's Data & Four Central Bank Policy Announcements
- Treasuries see-sawed off early Wednesday lows to steady/mixed in late trade, focus on Thursday's heavy data (weekly claims, CPI, regional Fed and Tsy TICS) and Riksbank, Norges, Bank of England and ECB policy announcements. Fed speakers are absent tomorrow.
- We won't get aggregate CPI levels for October tomorrow, but as part of the November report's unprecedented format, the BLS will include data for some but not all subcomponents for October.
- Currently, TYH6 trades -1 at 112-15.5, yielding 4.1509% (+.0059). Curves mildly steeper, 2s10s +.995 at 66.588, still well off yesterday's 69.086% high.
- The short-term technical condition in Treasuries is bearish and near-term resistance points remain. A continuation lower would refocus attention on key support at 111-29, the Dec 10 low. Clearance of this level would confirm a resumption of the bear leg and open 111-19, a Fibonacci projection.
- On the upside, a clear breach of 112-23, the Dec 12 high would instead strengthen a short-term bull cycle.
- Gov Waller indicates in Q&A earlier that he's forecasting GDP growth of 1.6% this year and 2.5% in 2026 (vs FOMC medians 1.7% / 2.3%), and that supply-side improvements mean that stronger growth will not translate into stronger inflation (an argument advanced by the Trump administration as well as some of Waller's FOMC colleagues such as Gov Miran).