US DATA: KC Fed’s Alternative Labor Index Echoes Steady U/E Rate Increase
- Updated for October two days ago, we add the “Alternative Version” of the KC Fed’s Labor Market Conditions Index (LMCI) to the broad list of labor indicators we have focused on for labor market clues under the government shutdown. Atlanta Fed's Bostic today described it as one of his favorite gauges of the labor market.
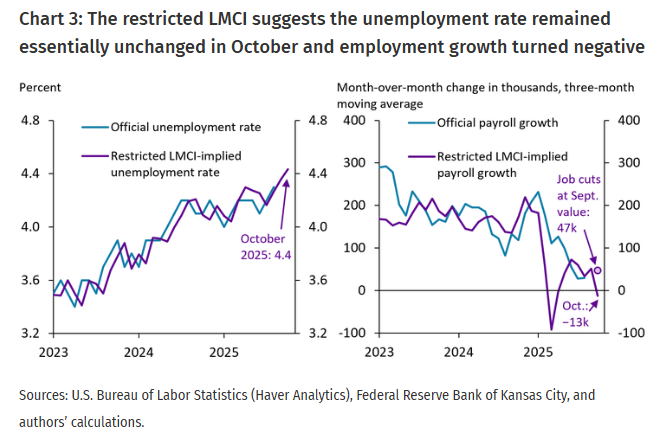
- This Alternative Version, which excludes delayed government series, “suggests little change in the labor market, but a deceleration in labor market momentum caused by a high number of announced job cuts [in the Challenger report]. This has pushed down our model's forecast of payroll employment growth for October.”
- This restricted model points to an unemployment rate of 4.4% in October, broadly chiming with the 4.36% from the Chicago Fed’s unemployment rate nowcast for a very mild deterioration from the 4.32% reported in latest BLS data for August.
- It also sees the economy losing an average of 13k jobs per month from Aug-Oct, “driven entirely by the aforementioned announced job cuts in October”.
- We see a high likelihood of the delayed September payrolls report being released between Friday to early next week although the White House has called into question whether the October jobs report will be published.
- See the MNI US Shadow Employment Report here, noting that it was published prior to Tuesday’s slide in the weekly ADP series (see US DATA: Weekly ADP Series Rolls Over – Nov 11, 1016ET).
Want to read more?
Find more articles and bullets on these widgets:
Historical bullets
AUDUSD TECHS: Bearish Threat
- RES 4: 0.6726 1.236 proj of the Jun 23 - Jul 24 - Aug 21 price swing
- RES 3: 0.6660/6707 High Sep 18 / 17 and a bull trigger
- RES 2: 0.6629 High Sep 30 & Oct 01 and key short-term resistance
- RES 1: 0.6560 50-day EMA
- PRICE: 0.6513 @ 08:11 BST Oct 13
- SUP 1: 0.6473 Low Oct 10
- SUP 2: 0.6463 Low Aug 27
- SUP 3: 0.6415 Low Aug 21 / 22 and a bear trigger
- SUP 4: 0.6373 Low Jun 23
A sharp sell-off in AUDUSD on Friday resulted in a break of 0.6521, the Sep 26 low, and 0.6484, the 76.4% retracement of the Aug 21 - Sep 17 bull leg. This undermines the recent bullish theme and instead signals scope for a deeper retracement, potentially towards key support at 0.6415, the Aug 21 and 22 low. Initial resistance to watch is 0.6560, the 50-day EMA. Key short-term resistance has been defined at 0.6629, the Sep 30 and Oct 1 high.
US TSYS: Tsys Rebound Late, 2s-10s Leading on Subdued Holiday Trade
- Treasury look to settle mixed, bonds weaker on very light volumes (TYZ5 670k) due to the Columbus Day holiday. The Dec'25 10Y contract currently trades at 113-05.5 (+1) - rebounding late with no obvious headline of Block-driven support.
- Normal Globex trade hours, stocks open - recovering approximately half of Friday's rout: the DJIA trades up 575.86 points (1.27%) at 46,057.31, S&P E-Minis up 98 points (1.49%) at 6,693, Nasdaq up 467.7 points (2.1%) at 22,674.98.
- No data, but Philly Fed Pres Anna Paulson (non-2025 FOMC voter, votes in 2026) said in a speech Monday that with rates "modestly restrictive now", she sees easing through year-end in line with the September SEP median - in other words, two more cuts by year-end. That's in line with MNI's assumption of her view.
- More Fed speakers tomorrow with focus on Chairman Powell's economic outlook keynote address at the NABE Annual Meeting at 1220ET.
EURJPY TECHS: Trend Needle Points North
- RES 4: 180.00 Psychological round number
- RES 3: 179.81 Top of a bull channel drawn from the Feb 28 low
- RES 2: 178.94 1.236 proj of the Jul 31 - Sep 29 - Oct 2 price swing
- RES 1: 177.94 High Oct 10 and the bull trigger
- PRICE: 176.13 @ 15:54 BST Oct 13
- SUP 1: 175.67 Low Oct 10
- SUP 2: 174.73 20-day EMA
- SUP 3: 173.24 High Oct 3 and a gap low on the daily chart
- SUP 4: 172.27 Low Oct 2 and a key medium-term support
The trend set-up in EURJPY is bullish despite the slippage of last week’s high - a corrective pullback. Key short-term support lies at 172.27, the Oct 2 low. First support to watch lies at 174.73, the 20-day EMA. Last week’s fresh cycle highs strengthen bullish conditions. The cross has cleared resistance at 175.13, the Sep 29 high, to confirm a resumption of the primary uptrend. A resumption of gains would open the 178.94, a Fibonacci projection.