US OUTLOOK/OPINION: ISM Services Seen Dipping In Nov Despite More Optimistic PMI
- The ISM services index is seen dipping to 52.0 in November to only modestly ease after a stronger than expected eight-month high of 52.4 in October.
- The index has ranged between 49.9 (May) and 53.5 (Feb) so far this year and more recently oscillated between 50 and 52 handles since July.
- Alternate indicators on balance point to some limited upside but that’s mainly from the services PMI, which is typically much more optimistic and by notably differing amounts month-to-month.
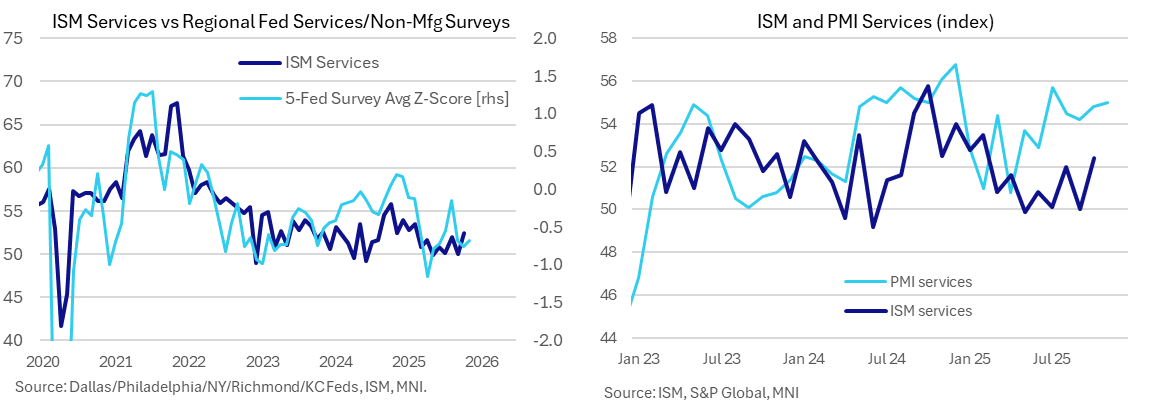
- S&P Global PMI: upside. The services PMI ticked up further to 55.0 in the flash November release from 54.8 in October for a fresh high since July and before that Dec 2024. As such, it points to both directional and level upside risk but, just as with the manufacturing survey, it has been far more optimistic than its ISM counterpart. It has averaged 3.4pts higher than ISM services in the latest six months but with a range of 2.1-5.6pts which means its predictive power should be viewed cautiously.
- Regional Fed surveys: neutral. The average of five regional Fed service/non-manufacturing surveys ticked down from -12.2 to -12.5 whilst the z-score inched higher from -0.8 to -0.7. The latter points to a small directional improvement on the month but is starting from a relatively lower level – see chart. The combination sees little conviction on risks to the ISM reading this month.
- There’s no consensus for new orders although we’ll watch them closely to see if it’s possible to decipher a trend after what has been a particularly noisy few months (56.2 in Oct, technically a twelve-month high, after 50.4 in Sep and 56.0 in Aug). The flash PMI (link) encouragingly noted the “largest rise in new business so far this year” along with its “strongest output gain since July”.
- The employment index meanwhile steadily increased in Sept and Oct to 48.2, still contractionary but a five-month high nevertheless. With no more BLS payrolls data due before the Dec 9-10 FOMC meeting, that should carry greater weight than usual.
Want to read more?
Find more articles and bullets on these widgets:
Historical bullets
AUD: AUD/USD - Consolidates Around 0.6550 Ahead Of RBA Tomorrow
The AUD/USD had a range Friday night of 0.6533-0.6553, Asia is trading around 0.6545. US yields retraced on Friday night but the USD continues to grind higher challenging levels last seen in July/August. The AUD/USD is back within its recent 0.6400-0.6650 range with the pivot being around 0.6500-0.6550 where I would expect some demand first up, RBA tomorrow but the market is not expecting them to move.
- MNI Policy: RBA Board To Hold, Push Out Midpoint Return. The Reserve Bank of Australia Board is expected to keep the cash rate at 3.6% next Tuesday following stronger-than-expected Q3 inflation and is likely to push back the anticipated return of inflation to the midpoint in updated forecasts released alongside the decision.
- Bloomberg reports Australian home prices climbed at the fastest pace in more than two years in October, underscoring how a resurgent property market threatens to complicate the RBA’s efforts to cool inflation in this week’s rate decision.
- Options : Closest significant option expiries for NY cut, based on DTCC data: 0.6600(AUD 338m). Upcoming Close Strikes : 0.6625(AUD944m Nov 4), 0.6300(AUD600m Nov 4) - BBG
- Data/Event: Melbourne Institute Inflation, ANZ-Indeed Job Advertisements, Building Approvals, Household Spending
Fig 1: AUD/USD spot Daily Chart

Source: MNI - Market News/Bloomberg Finance L.P
NEW ZEALAND: Unemployment Rate Forecast To Rise Again, Nov Easing Likely
The key event in NZ this week is the Q3 labour market and wages data released on Wednesday. Filled jobs for the quarter signal a stabilization but employment is likely to have remained weak with consensus forecasting it to rise only 0.1% q/q to be still down 0.2% y/y. The unemployment rate is expected to rise 0.1pp to 5.3%, in line with the RBNZ’s August projections. Soft labour demand is likely to weigh on private wage growth which is forecast to rise around 0.4% q/q after 0.6%.
- The RBNZ’s biannual financial stability report is also published on Wednesday. It is likely to be concerning if it shows an increase in mortgage arrears despite recent easing.
- In terms of housing data, October Cotality home values and September building permits are released Monday. The construction sector has lagged the rest of the economy but the ANZ business survey is showing some recovery.
- October ANZ commodity prices are released on Wednesday. They fell 1.1% m/m in September.
AUSSIE 10-YEAR TECHS: (Z5) Returns Lower
- RES 3: 95.982 - 76.4% retracement Sep’24 - Nov’24 downleg
- RES 2: 95.960 - High Apr 7 (cont.)
- RES 1: 95.900 - High Oct 17
- PRICE: 95.670 @ 16:16 GMT Oct 31
- SUP 1: 95.510 - Low Sep 3
- SUP 2: 95.415/95.300 - Low May 15 / Low Jan 14
- SUP 3: 95.275 - Low Nov 14 (cont) and a key support
Aussie 10-yr futures slipped lower Wednesday on the back of hotter-than-expected Australian inflation. This returned prices lower despite nascent signs of a technical recovery as recently as last week. The sustainability of the pullback will be dependent on prices holding above key short-term support at 95.510, the Sep 3 low. Near-term resistance remains 95.780, the Sep 12 high. A clear break of this level signals scope for a continuation higher and opens 95.960, the 76.4% retracement level for the Sep’24 - Nov’24 downleg.