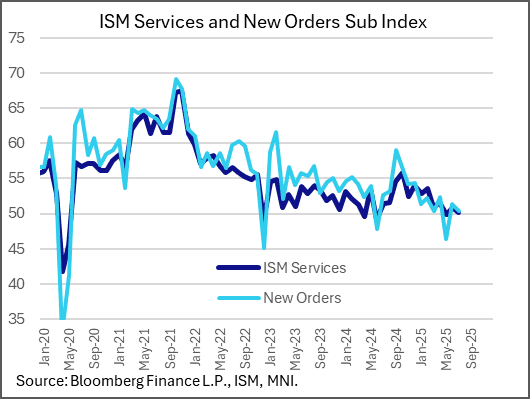
US DATA: ISM Services Points To Stagflationary Developments Amid Tariffs
July's ISM Services data were more "stagflationary" than anticipated, with a dip in activity amid a pickup in price pressures. The report overall suggests that firms' tariff-related concerns linger, with momentum failing to build on a brief improvement in June. Combined with the headline index, the subcomponents of the survey show a clear slowing in activity since late 2024.
- The headline Services PMI reading fell by 0.7 points to 50.1 (51.5 expected, 50.8 prior), merely a 2-month low but suggesting that an expected pickup in momentum and sentiment is not materializing. The ISM report writes that the index is consistent with 0.5% annualized real GDP growth. Business activity fell 1.6 points to 52.6.
- The main worrying point was new orders, which fell 1 point to 40.3 (no expectations). That was led by a 3.2 point drop in new export orders (47.9) - which apart from March 2025's tariff driven low (45.8) was the joint-weakest since March 2023. Imports fell 5.8 points from 51.7 - one firm's anecdote was “Imports have increased in price, to be less competitive than domestic vendors.”
- Employment, too, was a weak spot - down 0.8 points at 46.4, it's now declined in 2 consecutive months after a brief return above the 50.0 mark in May. It's now been below 50 in 4 of 5 months (i.e. contractionary). However, the anecdotes of the latest report make it difficult to know whether this squares with the broader "low hiring, low firing" theme in data elsewhere, with firms reporting supply-side restraints rather than weaker demand ("Comments from respondents include: “Lost a few service technicians; still difficult to recruit in this market” and “We have lost employees due to normal attrition and are having issues backfilling these positions with qualified candidates.”)
- Inventories fell by a second consecutive month, by 0.9 points to 52.7 (further evidence of pre-tariff buildup reversing; inventory sentiment pointed to inventories were "too high" at 53.2 albeit down from 57.1 prior and the lowest since Oct 2024), while supplier deliveries rose 0.7 points to 51.0 (slower supplier deliveries, which is a positive for the headline reading).
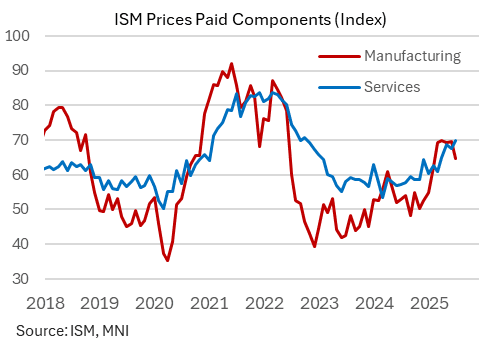
- Prices paid meanwhile ticked up 2.4 points to 69.9 (66.5 expected, 67.5 prior), a fresh 33-month high. While MNI had flagged potential upside risks to the prices reading, based on regional Fed surveys and the flash PMI report, this was even higher than we would have anticipated and defies a pullback in its manufacturing counterpart.
Want to read more?
Find more articles and bullets on these widgets:
Historical bullets
USDCAD TECHS: Trend Outlook Remains Bearish
- RES 4: 1.4111 High Apr 4
- RES 3: 1.4016 High May 12 and 13 and a key resistance
- RES 2: 1.3920 High May 21
- RES 1: 1.3674/3776 20- and 50-day EMA values
- PRICE: 1.3607 @ 16:12 BST Jul 4
- SUP 1: 1.3557 Low Jul 03
- SUP 2: 1.3540 Low Jun 16 and the bear trigger
- SUP 3: 1.3503 1.618 proj of the Feb 3 - 14 - Mar 4 price swing
- SUP 4: 1.3473 Low Oct 2 2024
The trend needle in USDCAD points south and this week’s move down reinforces current conditions. S/T gains between Jun 16 - 23 appear to have been corrective. Key support and the bear trigger is 1.3540, Jun 16 low. Clearance of this level would resume the downtrend and open 1.3503, a Fibonacci projection. Pivot resistance is at the 50-day EMA, at 1.3776. A clear break of this average would signal scope for a stronger recovery.
AUDUSD TECHS: Bull Cycle Remains In Play
- RES 4: 0.6700 76.4% retracement of the Sep 30 ‘24 - Apr 9 bear leg
- RES 3: 0.6688 High Nov 7 ‘24
- RES 2: 0.6603 High Nov 11 ‘24
- RES 1: 0.6590 High Jul 01
- PRICE: 0.6548 @ 16:05 BST Jul 04
- SUP 1: 0.6521 20-day EMA
- SUP 2: 0.6468/6373 50-day EMA / Low Jun 23 and a reversal trigger
- SUP 3: 0.6357 Low May 12
- SUP 4: 0.6275 Low Apr 14
The trend set-up in AUDUSD remains bullish and the pair is holding on to its recent gains. The latest break higher maintains the bullish price sequence of higher highs and higher lows, the definition of an uptrend. Moving average studies are in a bull-mode position, highlighting a dominant uptrend. Sights are on 0.6603 next, the Nov 11 2024 high. Key short-term support has been defined at 0.6373, the Jun 23 low.
EURJPY TECHS: Northbound
- RES 4: 171.88 High Jul 19 ‘24
- RES 3: 171.28 1.382 proj of the Feb 28 - Mar 18 - Apr 7 price swing
- RES 2: 171.09 High Jul 23 ‘24
- RES 1: 170.61 High Jul 03
- PRICE: 170.22 @ 16:04 BST Jul 04
- SUP 1: 169.04 Low Jul 02
- SUP 2: 167.87 20-day EMA
- SUP 3: 167.13 Low Jun 20
- SUP 4: 165.66 50-day EMA
EURJPY traded higher on Thursday resulting in a print above 170.47, the 76.4% retracement of the Jul 11 - Aug 5 sell-off. A clear break of this price point would strengthen bullish conditions and signal scope for extension. This would open 170.28 next, a Fibonacci projection. The trend is overbought, a pullback would unwind this condition. Support to watch lies at 167.87, the 20-day EMA.