US DATA: Imported Inflation Ended 2025 On A Stronger Note
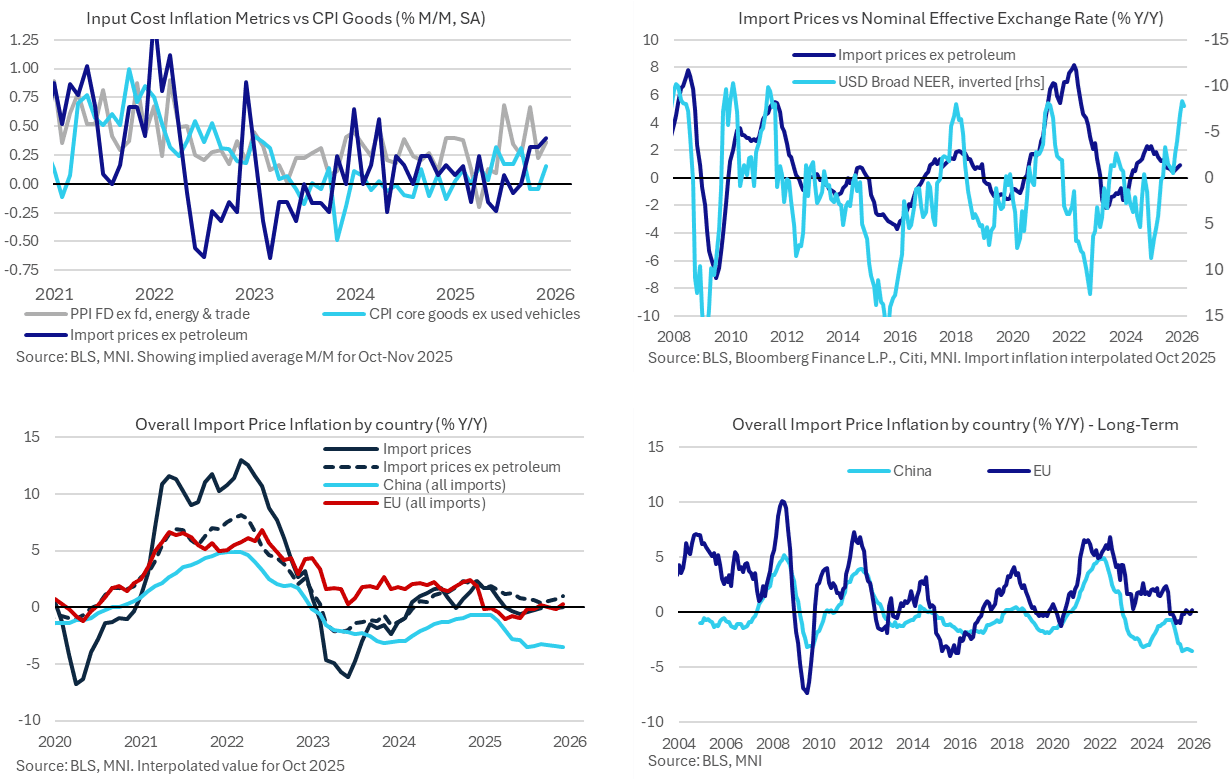
Non-oil import prices were stronger than expected in December as they ended the year with some upward price pressures and with potentially more to come judging by US dollar depreciation. Bearing in mind that import prices don’t include tariffs, it points to a notably different backdrop than earlier in 2025 when foreign exporters were offering greater concessions in the face of tariffs. China stands out with firmly negative import price inflation whilst import prices from other trading partners have firmed.
- Overall import prices were as expected in December as they increased 0.1% M/M but they hid a stronger underlying picture as import prices ex petroleum increased 0.4% M/M (cons 0.2) for the strongest single month since Apr 2024.
- The latter stat is with a heavy caveat that it’s non-seasonally adjusted data and it follows an average 0.3% M/M increase across Oct & Nov but with no way of knowing the split across those two months as a result of the government shutdown.
- This recent period of strength (average of 0.34% M/M in Q4 compares with 0.16% in 4Q24) follows weakness earlier in the year when foreign exporters were offering concessions in the face of US tariffs (average -0.1% M/M in Mar-Jun 2025 vs 0.2% M/M in Mar-Jun 2024).
- This pick-up in import price pressures follows months of stronger PPI reports although passthrough into core goods CPI inflation appears to have been more moderate recently.
- It has seen the Y/Y accelerate further to 1.0% Y/Y for its highest since May and with the US dollar's trade-weighted depreciation very crudely pointing to upside ahead.
- China remains a clear standout here though at -3.5% Y/Y, matching July for the lowest in a series starting in 2004.
- Elsewhere, prices of imports from the EU climbed 0.3% Y/Y in December for the highest since Dec 2024 having bottomed at -1.0% Y/Y in April.
- Attempting to strip out oil price effects from major oil producers, prices of manufactured imports from Canada increased 1.5% Y/Y (highest since Dec 2022) and from Mexico increased 2.1% Y/Y (highest since 2.2% in Sept). These USMCA countries have seen the smallest adjustments in trade balances with the US since the start of the second Trump administration.
Want to read more?
Find more articles and bullets on these widgets:
Historical bullets
AUSSIE 3-YEAR TECHS: (H6) Recovery Mode
- RES 3: 97.796 - 1.618 proj of the Sep 3 - 12 - 15 price swing
- RES 2: 96.780 - High Jun 26 (cont)
- RES 1: 96.700 - High Sep 12
- PRICE: 95.890 @ 16:40 GMT Jan 9
- SUP 1: 95.740 - Low Dec 22
- SUP 2: 95.480 - Low 1st Nov ‘23
- SUP 3: 94.932 - 1.0% 10-dma envelope
Prices bounced again Thursday, supported by strength in global bond markets and a smoother inflation picture at the December CPI print. As such, prices edged further away from recent lows. Nonetheless, slower pricing for additional RBA easing - and partial pricing for a return to rate hikes in 2026 - should keep the front-end of the curve under pressure. This keeps prices well below prior resistance at 96.615, the Sep 12 high, and refocuses attention on 95.480 as the next major support.
MNI: MNI TEST 02, Please Ignore
Test Test TEST
MNI: MNI Test, Please Ignore
Test, ignore