NATGAS: Gas Summary At European Close: TTF Falls
TTF front month has fallen amid some signs of easing geopolitical risks around Iran and Russia-Ukraine having previously risen to the highest since June early in the session due to supply concerns owing to cold weather and surging prices in the US.
- TTF FEB 26 down 2.8% at 38.12€/MWh
- Zelenskiy signalled that trilateral meetings between the US, Ukraine and Russia will take place in the UAE across the next two days ‘at a technical level.’ Meanwhile, President Trump today said that Iran “does want to talk, and we will talk.”
- Henry Hub prices have surged higher with cold weather risks to heating demand and production shut ins.
- The Clean Resolution looks to be switching away from a course to Asia to head to Europe instead, according to ICIS analyst Alex Froley.
- Temperatures in NW Europe are forecast to see a cooling trend to below normal from the weekend, but model runs suggests temperatures back closer to normal by the end of the month. CWE wind generation will be on general downward trend over Jan. 24-26 before rebounding over Jan. 27-29.
- NW European LNG sendout is estimated down at 267.3mcm/d yesterday compared to an average of 295.2mcm/d so far this month, Bloomberg shows.
- European gas storage has fallen to 48.36% full on Jan. 20, according to GIE data compared to the previous five-year seasonal average of 63.1% full, after larger than normal net withdrawals on the day.
- Norwegian pipeline supplies to Europe edge back up to 335.4mcm/d. Gassco still shows capacity reductions at Gullfaks and Nyhamna totalling 24.8mcm/d this week.
- Gas-fired power generation for Japan’s Tokyo area rose to the highest level since March 2024 with cold weather boosting heating demand, according to Bloomberg.
- Australian independent Santos is loading its first cargo in over two years from its 3.7 mtpa Darwin LNG facility in Australia, the firm said today, cited by Argus.
Want to read more?
Find more articles and bullets on these widgets:
Historical bullets
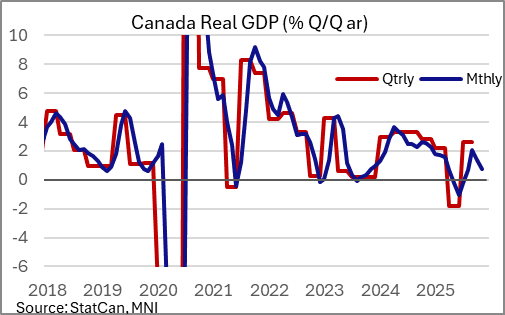
CANADA DATA: Monthly GDP Points To Soft Q4 Growth Reading
Canadian GDP by industry came in at the -0.3% M/M expected in October from both the advance estimate and consensus. This more than reversed the September gain of 0.24% M/M (the unrounded October figure was -0.34%) and leaves GDP effectively flatlined vs the start of the year, with the monthly growth rates continuing to print in erratic fashion with positive readings followed the next month by negative growth over much of the year.
- On balance it probably lessens the impetus for a Bank of Canada rate hike in the near future. Q4 is tracking to post a sharp slowdown in GDP growth from Q3's 2.6% Q/Q SAAR, with a contraction not out of the question given the very weak October start to the quarter.
- Recall that Q3 easily beat the BOC's October MPR estimate of +0.5%, so the level of GDP is already higher than expected (not to mention large revisions to prior years in the interim), but the +1.0% projected for Q4 may prove to be too high.
- The StatCan advance estimate for November showed a bit of traction in activity, with a 0.1% M/M growth rate projected ("Increases in educational services, construction and transportation and warehousing were partially offset by decreases in mining, quarrying, and oil and gas extraction and manufacturing."). Indeed positive advance retail and wholesale sales estimates for November suggest a bit more economic solidity in the month.
- But the Y/Y growth rate has slowed to 0.3% in Oct and (est) 0.7% in Nov, with the 3M/3M annualized growth rate having slowed to 0.8% after a 2.1% rate in September pointed to a strongly positive Q3 quarterly GDP reading (2.6% Q/Q SAAR).
- As for October, growth contracted across both goods producing (-0.7%) and services (-0.2%) industries. That included contractions in manufacturing (-1.5%, subtracting the most from GDP), wholesale trade (-0.9%), retail (-0.6%, impacted by labor activity in B.C.), construction (-0.4%, firsrt decline in 6 months), public sector (-0.3%, including educational services which fell on an Alberta teachers' strike) and mining (-0.6%, with oil and gas contracting following 4 consecutive expansions), with real estate (+0.2%) and public administration (+0.1%) ekeing out gains.
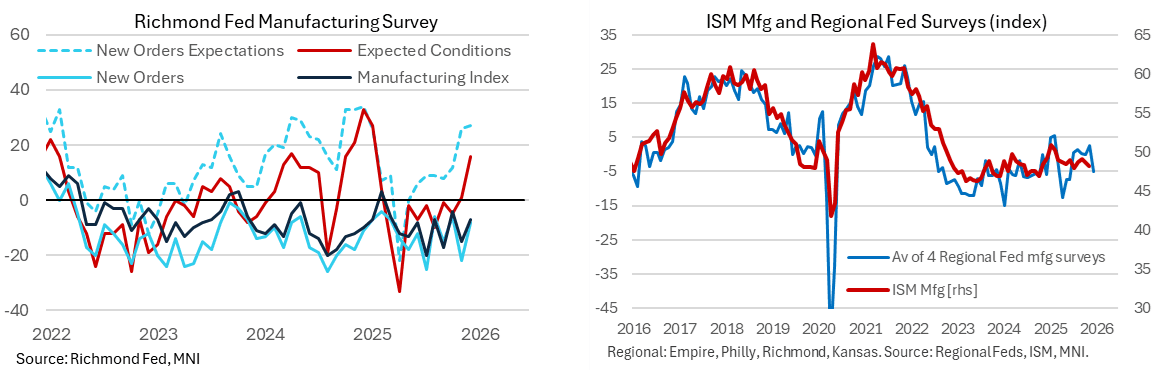
US DATA: Richmond Manufacturers Expect Solid Improvement In Local Conditions
The Richmond Fed manufacturing index saw a relative improvement in December as it bucked the trend from three other regional Fed surveys which had all deteriorated. A sideways and noisy recent pattern makes it hard to get a sense of trend in current activity although six-month ahead expectations of local business conditions saw a solid improvement after prior increases in new orders and shipments.
- The Richmond Fed manufacturing index fared a little better than expected in December, rising to -7 (Bloomberg cons -10) after -15.
- It broadly continued a recent run of oscillating between -4 and -20 in 2H25 in patterns that have largely been seen in new orders albeit with some greater volatility (latest -8 after -22).
- Six-month ahead expectations of local business conditions offered a stronger take though, rising to 16 after the 1 in November was its first positive since February.
- This improvement follows a previous increase for new orders (27 after 26 in Nov and 12 in Oct) and shipments (28 and 25 in Nov and 13 in Oct) which was largely cemented this month, although the number of employees index also saw a reasonable increase this month (8 after -1 in Nov and 2 in Oct).
- Back to current indicators, the sequential increase goes against deterioration seen in the other regional Fed surveys with Empire at -3.9 after 18.7, Philly at -10.2 after -1.7 and Kansas at 1 after 8.
- The average of these four regional Fed surveys fell to -5.0 in Dec from 2.5 for its lowest since June, pointing to downside momentum risk to ISM manufacturing (released Jan 5). We’ll revert on the latest for manufacturing indicators after Dallas (Dec 29) and the MNI Chicago PMI (Dec 30).
US 10YR FUTURE TECHS: (H6) Opens Gap With Resistance
- RES 4: 113-09 76.4% retracement of the Nov 25 - Dec 10 bear leg
- RES 3: 113-07 High Dec 3
- RES 2: 112-31/113-00+ High Dec 18 / 61.8% of Nov 25 - Dec 10 leg
- RES 1: 112-21+ 50-day EMA
- PRICE: 112-07 @ 15:57 GMT Dec 23
- SUP 1: 112-01+/111-29 Low Dec 23 / 10 and the bear trigger
- SUP 2: 111-19 1.236 proj of the Oct 17 - Nov 5 - 25 price swing
- SUP 3: 111-11 1.382 proj of the Oct 17 - Nov 5 - 25 price swing
- SUP 4: 111-00 Round number support
Treasuries fell sharply on the back of the stronger-than-expected US GDP print, opening a sizeable gap with key short-term resistance into 112-31, the Dec 18 high. Renewed weakness here would refocus attention on 111-29, the Dec 10 low and a key short-term support. A breach of this support resumes the bear cycle that started Oct 17. Instead, clearance higher would signal scope for a stronger corrective phase and open 113-00 initially, a Fibonacci retracement point.