EUROPEAN INFLATION: French HICP Confirmed At 0.9% Y/Y In Final July Print
Aug-14 10:09
French final July HICP was unrevised from the flash release on a rounded basis, printing 0.9% Y/Y for a second month running. Still, it’s worth remembering that the initial consensus ahead of the flash release was 0.8% Y/Y.
- Headline CPI was also unrevised at 1.0% Y/Y for a second month running at its fastest since January. .
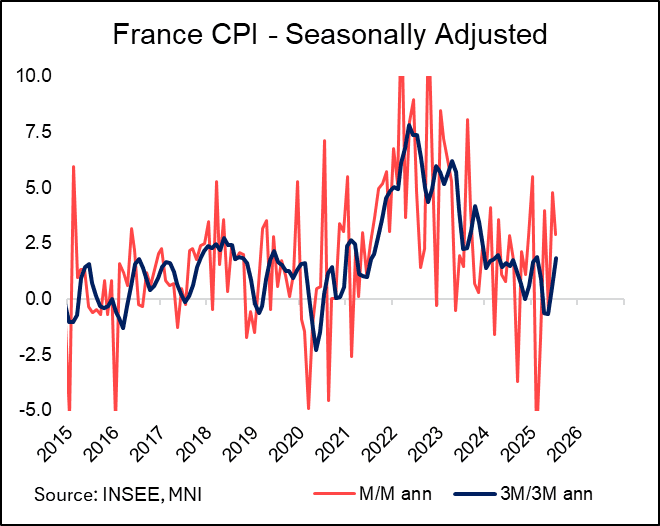
- On a seasonally adjusted basis using INSEE data, CPI rose 0.24% M/M, below June’s 0.39% but above the YTD average of 0.09%. 3m/3m SA annualized CPI rose to 1.8% vs 0.6% prior, the highest rate since February.
- Core inflation (excluding energy and unprocessed foods) increased to 1.5% Y/Y (vs 1.2% prior).
- Looking at the CPI components:
- Services was confirmed at 2.5% Y/Y after 2.4% in May. Airfares drove that acceleration, as the category rose to 7.6% Y/Y (4.6% prior). Elsewhere, communication services was a little higher than in June (-11.3% vs -12.1%). Services on health and those for rent, water and household waste collection both were unchanged in their Y/Y rates, at 1.5% and 2.6%, respectively.
- Non-energy industrial goods was confirmed at -0.2% Y/Y%, around which it tracked for five consecutive months now.
- Food inflation was confirmed at 1.6% Y/Y (vs 1.4% prior). Processed foods (1.6% vs 1.4% prior) will have driven core CPI higher (which it is not excluded from).
- Energy inflation was also confirmed at -7.2% Y/Y (vs -6.7 prior).
Want to read more?
Find more articles and bullets on these widgets:
Historical bullets
EQUITIES: US Earnings Season Kicks Off In Earnest Today
Jul-15 10:04
Earnings season starts in earnest today, with big banks in focus including:
- 1145BST/0645ET: JP Morgan
- 1200BST/0700ET: Wells Fargo
- 1300BST/0800ET: Citigroup
- Before-market: BNY Mellon
Our full US earnings schedule including timings, EPS & revenue expectations here: https://media.marketnews.com/MNIUSEARNINGS_110725_c282a28044.pdf
OUTLOOK: Price Signal Summary - S&P E-Minis Trend Needle Points North
Jul-15 09:53
- In the equity space, the trend condition in S&P E-Minis remains bullish and the contract is trading at its latest highs. Recent activity has resulted in a break of resistance at 6128.75, the Jun 11 high. The breach confirmed a resumption of the uptrend that started Apr 7. This was followed by a break of key resistance and a bull trigger at 6277.50, the Feb 21 high. Sights are on 6356.12, a 1.236 projection of the May 23 - Jun 11 - 23 price swing. Key support is at the 50-day EMA, at 6064.44. First support lies at 6211.67, the 20-day EMA.
- A bull cycle in EUROSTOXX 50 futures remains in play and the latest pullback appears corrective. Recent gains have exposed key resistance and the bull trigger at 5486.00, the May 20 high. It has been pierced, a clear break of it would confirm a resumption of the medium-term bull cycle that began Apr 7 and open the 5500.00 handle. Support to watch lies at 5281.00, the low on Jul 1 and 4.
US OUTLOOK/OPINION: An Addendum To MNI US CPI Preview On Tariff Rates
Jul-15 09:46
- The below bullet is an addendum to the MNI US CPI Preview that was sent out yesterday (found here)
- It adds color to the section on the timing and magnitude of tariff hits, especially the remarks San Francisco Fed’s Daly made in a MNI webinar last week about the tariff collections data tracking below expected effective tariff rates.
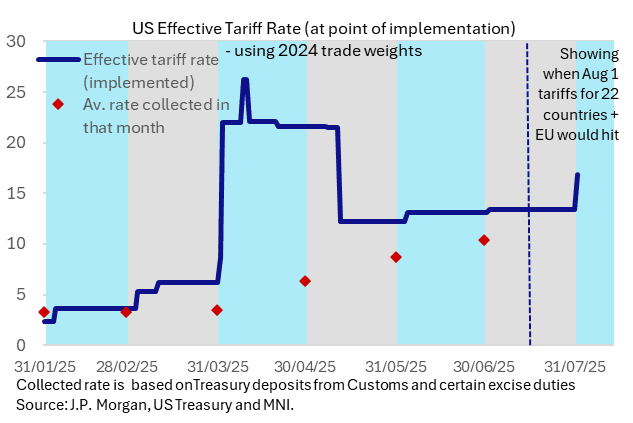
- The static analysis takes effective tariff rates from J.P. Morgan calculations, in the chart below showing them at point of implementation rather than actual announcement, and compares them with average collection rates over the course of that month using US Treasury data for deposits from customs and certain excise duties.
- The latest message is similar to that from Daly: tariff collections data showed an average rate of ~10% in June after nearly 9% in May and 6% in April vs an effective rate of ~13% in June but one which could be 17% with new reciprocal tariffs slated for Aug 1; Daly referenced 8-9% collection rates vs an expected effective tariff rate of ~16%. The below also offers a useful look at how this has incrementally increased over time.
- It doesn’t however give insight into burden sharing across importers, businesses and consumers, something we go more into in the main preview.