US DATA: Final PMIs For July Revised Up Further With Robust Services
The S&P Global final PMIs for July were stronger than first thought, with the services PMI further confirming a fresh high since December. The soon to be released ISM Services will provide a useful alternative indicator for services activity in July after undershooting by 2.1pts back in June.
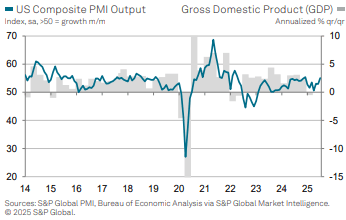
- Services PMI: 55.7 (cons & prelim 55.2) in July after 52.9 in June
- Composite PMI: 55.1 (cons & prelim 54.6) in July after 52.9 in June.
The press release overview was similar to the flash release a few weeks ago. Some highlights more generally are stronger new orders along with tariffs having a clear impact on price pressures.
- “Where business activity rose, service providers often linked this to higher new orders, with anecdotal evidence also highlighting improvements in customer demand, the securing of new clients and work on new products.
- New orders expanded for the fifteenth consecutive month in July. As was the case with activity, the rate of expansion in new business picked up from June. The latest rise was solid and the fastest since January.
- New export orders have now decreased in each of the past four months, although the latest reduction was only marginal and the slowest in this sequence.”
- Price pressures: “Tariffs also had a clear impact on price pressures, according to anecdotal evidence. Companies widely linked the latest increase in input costs to the effects of tariffs, while also mentioning higher salaries. Input prices rose sharply, with the pace of inflation accelerating from June and coming in above the series average.
- Similarly, the pace of output price inflation quickened over the month and was steep. Panelists reported passing on tariff related rises in input costs to their customers. Here too, the increase was marked in the context of historical data.”
Want to read more?
Find more articles and bullets on these widgets:
Historical bullets
USDCAD TECHS: Trend Outlook Remains Bearish
- RES 4: 1.4111 High Apr 4
- RES 3: 1.4016 High May 12 and 13 and a key resistance
- RES 2: 1.3920 High May 21
- RES 1: 1.3674/3776 20- and 50-day EMA values
- PRICE: 1.3607 @ 16:12 BST Jul 4
- SUP 1: 1.3557 Low Jul 03
- SUP 2: 1.3540 Low Jun 16 and the bear trigger
- SUP 3: 1.3503 1.618 proj of the Feb 3 - 14 - Mar 4 price swing
- SUP 4: 1.3473 Low Oct 2 2024
The trend needle in USDCAD points south and this week’s move down reinforces current conditions. S/T gains between Jun 16 - 23 appear to have been corrective. Key support and the bear trigger is 1.3540, Jun 16 low. Clearance of this level would resume the downtrend and open 1.3503, a Fibonacci projection. Pivot resistance is at the 50-day EMA, at 1.3776. A clear break of this average would signal scope for a stronger recovery.
AUDUSD TECHS: Bull Cycle Remains In Play
- RES 4: 0.6700 76.4% retracement of the Sep 30 ‘24 - Apr 9 bear leg
- RES 3: 0.6688 High Nov 7 ‘24
- RES 2: 0.6603 High Nov 11 ‘24
- RES 1: 0.6590 High Jul 01
- PRICE: 0.6548 @ 16:05 BST Jul 04
- SUP 1: 0.6521 20-day EMA
- SUP 2: 0.6468/6373 50-day EMA / Low Jun 23 and a reversal trigger
- SUP 3: 0.6357 Low May 12
- SUP 4: 0.6275 Low Apr 14
The trend set-up in AUDUSD remains bullish and the pair is holding on to its recent gains. The latest break higher maintains the bullish price sequence of higher highs and higher lows, the definition of an uptrend. Moving average studies are in a bull-mode position, highlighting a dominant uptrend. Sights are on 0.6603 next, the Nov 11 2024 high. Key short-term support has been defined at 0.6373, the Jun 23 low.
EURJPY TECHS: Northbound
- RES 4: 171.88 High Jul 19 ‘24
- RES 3: 171.28 1.382 proj of the Feb 28 - Mar 18 - Apr 7 price swing
- RES 2: 171.09 High Jul 23 ‘24
- RES 1: 170.61 High Jul 03
- PRICE: 170.22 @ 16:04 BST Jul 04
- SUP 1: 169.04 Low Jul 02
- SUP 2: 167.87 20-day EMA
- SUP 3: 167.13 Low Jun 20
- SUP 4: 165.66 50-day EMA
EURJPY traded higher on Thursday resulting in a print above 170.47, the 76.4% retracement of the Jul 11 - Aug 5 sell-off. A clear break of this price point would strengthen bullish conditions and signal scope for extension. This would open 170.28 next, a Fibonacci projection. The trend is overbought, a pullback would unwind this condition. Support to watch lies at 167.87, the 20-day EMA.