US DATA: Factory Orders Report Doesn’t Materially Alter Core Orders Q2 Softness
The factory orders report for June didn’t contain any major surprises, with core orders continuing to point to pullback in the value of orders in Q2 after surging in Q1 on tariff front-running. It chimes with recent weakness in the ISM manufacturing survey, where July’s soft report suggests more of the same ahead in the near-term albeit with a questionable fit between the two now.
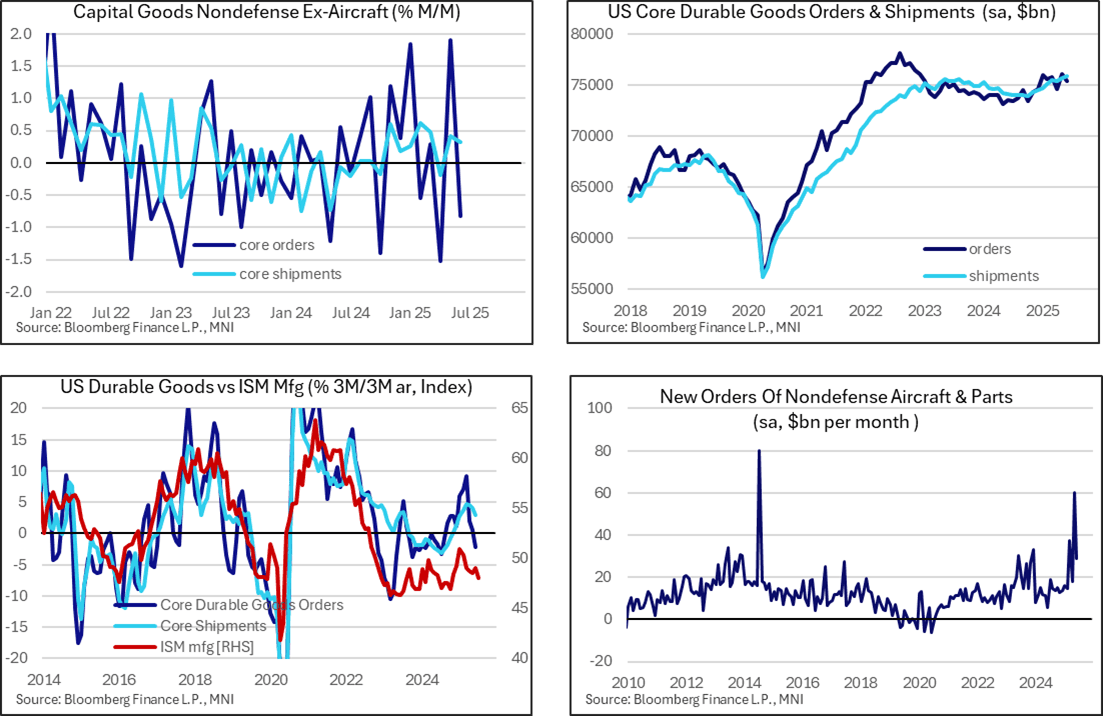
- Factory orders fell -4.8% M/M (sa, cons -4.8) in June after 8.3% (initial 8.2) in May as they confirmed gyrations driven by nondefense aircraft in the previously released durable goods data (-52% M/M in June after 232% in May).
- Far less volatile core durable goods data meanwhile saw marginal downward revisions for June that don’t alter a trend of recent positive momentum in shipments but with orders slipping.
- Specifically, core shipments rose 0.3% M/M in June (initial -0.4) after an unrevised 0.4% M/M in May, whilst core orders fell -0.8% M/M (initial -0.7) after a downward revised 1.9% (initial 2.0).
- It leaves core shipments rising a nominal 2.9% (initial 3.1) annualized in Q2 after 4.7% in Q1, whereas core orders have slipped -2.1% (initial -1.7%) after 9.2% in Q1.
- This weakness in orders is more in keeping with the ISM manufacturing survey even if there has been a disconnect between the two. July’s surprisingly weak ISM mfg saw its headline index fall to 48.0 for its lowest since October whilst its new orders component at 47.1 notched a six consecutive monthly reading in contractionary territory.
Want to read more?
Find more articles and bullets on these widgets:
Historical bullets
USDCAD TECHS: Trend Outlook Remains Bearish
- RES 4: 1.4111 High Apr 4
- RES 3: 1.4016 High May 12 and 13 and a key resistance
- RES 2: 1.3920 High May 21
- RES 1: 1.3674/3776 20- and 50-day EMA values
- PRICE: 1.3607 @ 16:12 BST Jul 4
- SUP 1: 1.3557 Low Jul 03
- SUP 2: 1.3540 Low Jun 16 and the bear trigger
- SUP 3: 1.3503 1.618 proj of the Feb 3 - 14 - Mar 4 price swing
- SUP 4: 1.3473 Low Oct 2 2024
The trend needle in USDCAD points south and this week’s move down reinforces current conditions. S/T gains between Jun 16 - 23 appear to have been corrective. Key support and the bear trigger is 1.3540, Jun 16 low. Clearance of this level would resume the downtrend and open 1.3503, a Fibonacci projection. Pivot resistance is at the 50-day EMA, at 1.3776. A clear break of this average would signal scope for a stronger recovery.
AUDUSD TECHS: Bull Cycle Remains In Play
- RES 4: 0.6700 76.4% retracement of the Sep 30 ‘24 - Apr 9 bear leg
- RES 3: 0.6688 High Nov 7 ‘24
- RES 2: 0.6603 High Nov 11 ‘24
- RES 1: 0.6590 High Jul 01
- PRICE: 0.6548 @ 16:05 BST Jul 04
- SUP 1: 0.6521 20-day EMA
- SUP 2: 0.6468/6373 50-day EMA / Low Jun 23 and a reversal trigger
- SUP 3: 0.6357 Low May 12
- SUP 4: 0.6275 Low Apr 14
The trend set-up in AUDUSD remains bullish and the pair is holding on to its recent gains. The latest break higher maintains the bullish price sequence of higher highs and higher lows, the definition of an uptrend. Moving average studies are in a bull-mode position, highlighting a dominant uptrend. Sights are on 0.6603 next, the Nov 11 2024 high. Key short-term support has been defined at 0.6373, the Jun 23 low.
EURJPY TECHS: Northbound
- RES 4: 171.88 High Jul 19 ‘24
- RES 3: 171.28 1.382 proj of the Feb 28 - Mar 18 - Apr 7 price swing
- RES 2: 171.09 High Jul 23 ‘24
- RES 1: 170.61 High Jul 03
- PRICE: 170.22 @ 16:04 BST Jul 04
- SUP 1: 169.04 Low Jul 02
- SUP 2: 167.87 20-day EMA
- SUP 3: 167.13 Low Jun 20
- SUP 4: 165.66 50-day EMA
EURJPY traded higher on Thursday resulting in a print above 170.47, the 76.4% retracement of the Jul 11 - Aug 5 sell-off. A clear break of this price point would strengthen bullish conditions and signal scope for extension. This would open 170.28 next, a Fibonacci projection. The trend is overbought, a pullback would unwind this condition. Support to watch lies at 167.87, the 20-day EMA.