US DATA: Even Gold Aside, Trade Deficits Were Wide Through February
Apr-03 13:10
The US trade deficit remained unusually wide in February at $122.7B (after $130.7B prior, downwardly revised from $131.4B). That was slightly smaller than expected ($123.5B survey), though the difference was accounted for by the January revision.
- Goods exports picked up 4.8% M/M with services declining 0.4% (first fall since June 2024), while goods imports dipped 0.2% (after +12.3% in January), with services imports growth steady at 0.7%.
- We'll take a closer look at the gold import impact in a separate note but the data for "finished metal shapes" suggests gold imports remained high at $31.7B - a major contributor to the overall deficit - albeit a small dip from $34.2B in January.
- As such it remains trickier to assess the dynamics of the "underlying" trade deficit, but we know the $253B goods and services deficit through the first two months of the year is easily a record for such a span in nominal terms. Without the rise in gold imports, the deficit would probably have been under $200B - but still elevated (vs a 2-month average $150B over 2024).
- Goods imports outside of the "industrial supplies and materials" haven't really picked up much in nominal terms early 2025, not even automobiles (still running around $37-38B monthly), though consumer goods show signs of tariff front-running ($80.7B February deficit, a single-month record, after $78.3B in January), and the overall goods import rises in real terms have been strong vs weak exports.
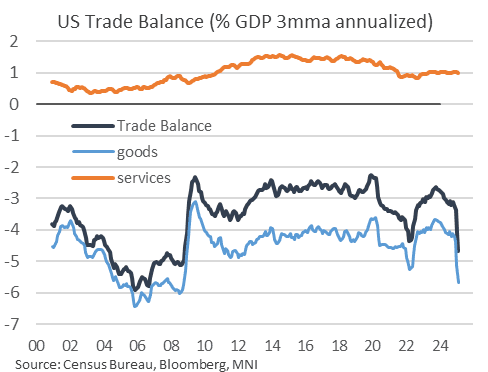
- In terms of GDP, the 3month moving average of the trade deficit has risen to around 4.7% of GDP, a post-2008 high and up from 2.9% a year earlier. The goods deficit is running at 5.7% of GDP the last 3 months, well up from 4.2% in November, with Services continuing to run its long-standing 1.0% of GDP surplus.
- And from a tariffs perspective, the biggest bilateral goods trade balance deterioration appears gold-related (eg deficit with Switzerland of 0.7% of US GDP over the last 3 months, vs a longer-term average of 0.1%).
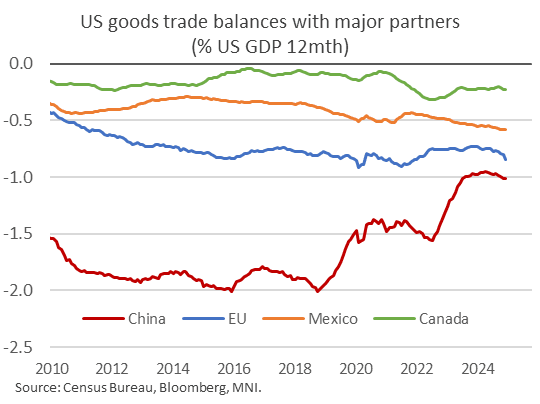
- The 12-month rolling goods trade deficits with Canada (0.2% of GDP), Mexico (0.6%), the EU (0.8%), and China (1.0%) are all fairly steady over the last few months, though have gotten slightly larger since the start of 2024.
Want to read more?
Find more articles and bullets on these widgets:
Historical bullets
STIR: SFIM5 96.15/96.45 Call Spread Sold Again
Mar-04 13:05
SFIM5 96.15/96.45 call spread, another 12K given at 1.25, 42K in total.
GILT PAOF RESULTS: GBP 562.498mln of the 4.375% Jul-54 Gilt sold.
Mar-04 13:02
- GBP 562.500mln had been on offer.
- This leaves GBP 28.908bln of the gilt in issue.
STIR: SFIM5 96.15/96.45 Call Spread Sold
Mar-04 13:02
SFIM5 96.15/96.45 call spread 30K given at 1.25