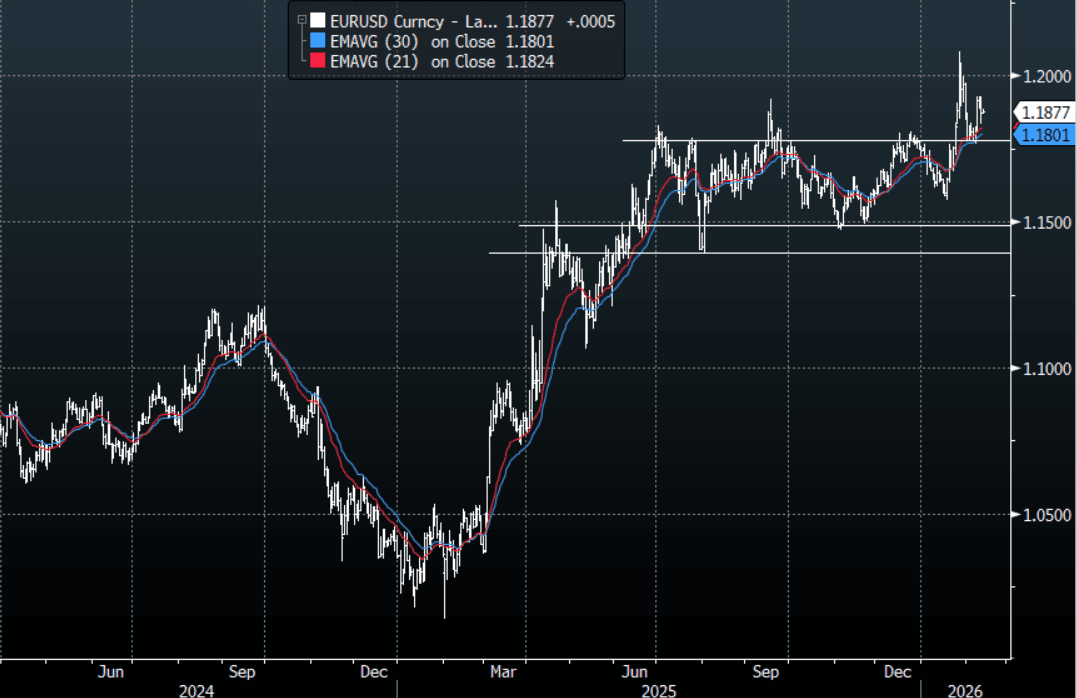
EURUSD: EUR/USD-Bounces Off 1.1830, But The Move Lags Other Currencies For Now
The EUR/USD range overnight was 1.1833 - 1.1927, Asia is currently trading around 1.1880. The pair found buyers back toward 1.1800 as the USD initially got bought, but unlike other currencies the EUR has not quite got back to its highs from yesterday. Price action remains constructive, can it now build some momentum from that base to push on? On the day, the first support is back toward 1.1820-1.1850 and then the 1.1750 area. A sustained move back above 1.1925-1.1940 could give it the thrust it needs to have another look toward the 1.2000 area.
- MNI: Draghi's 'Pragmatic Federalism' Gains Support- Official. Mario Draghi's call for "pragmatic federalism" among varying subsets of European Union states in order to accelerate the completion of the Single Market is finding support among some EU leaders ahead of Thursday's "brainstorming" session in Belgium.
- “Bundesbank President Joachim Nagel told Politico that he supports more joint EU debt to increase the region’s appeal to investors.” - BBG
- Options : Closest significant option expiries for NY cut, based on DTCC data: 1.1750(EU1.51b), 1.1760(EU777m), 1.1880(EU461m). Upcoming Close Strikes : 1.1800(EU3.18b Feb 13), 1.1850(EU4.39b Feb 13), 1.1950(EU2.76b Feb 13) - BBG
- The EUR/USD Average True Range for the last 10 Trading days: 67 Points
Fig 1 : EUR/USD Spot Daily Chart
Source: MNI - Market News/Bloomberg Finance L.P
Want to read more?
Find more articles and bullets on these widgets:
Historical bullets
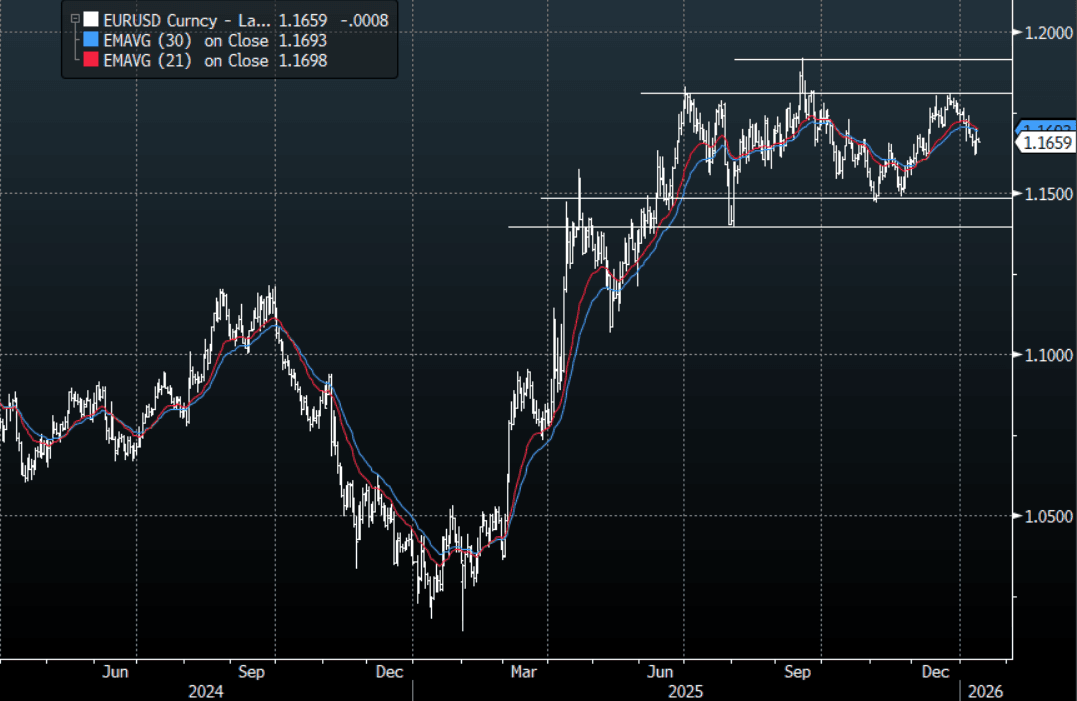
EUR: EUR/USD - 1.1700 Caps Move, Looks Like We Tread Water For Now
The overnight range was 1.1663 - 1.1699, Asia is currently trading around {EURUSD Curncy}. The pair found sellers again back toward 1.1700 capping the knee-jerk reaction to the Fed news. We are firmly back in the wider 1.1450-1.1850 range which dominated the last 6 months of the year and we need a catalyst to get a break and some sort of a trend going again. On the day it looks likely we tread water within a narrower 1.1600-1.1725 range as the market looks for a trigger to regain some momentum.
- The EUR/USD Average True Range for the last 10 Trading days: 43 Points
Fig 1 : EUR/USD Spot Daily Chart
Source: MNI - Market News/Bloomberg Finance L.P
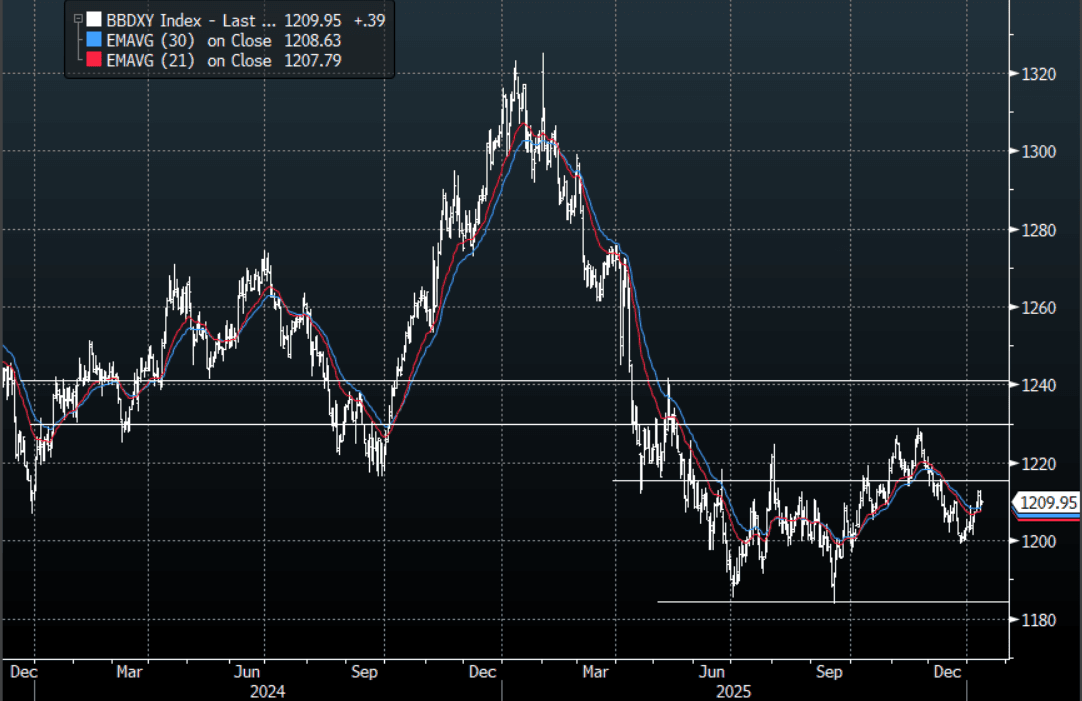
USD: BBDXY - Looks Directionless Within 1205-1215 For Now
The BBDXY range overnight was 1207.54 - 1210.11, Asia is currently trading around {BBDXY Index}. The USD found some support around the 1208 area after the initial knee-jerk lower. This leaves the USD in the middle of its recent range without any clear direction. On the day, it looks like 1205-1215 should cover it for now, watch for any ruling from the Supreme court as well as a potential incursion into Iran to maybe shake it up a little. This lack of a trend is being reflected in the CFTC data which shows very little positioning in the USD Index to start the year.
- MNI INTERVIEW: Fed Could Cut Around 100BP This Year-Bell. The Federal Reserve has ample room to keep cutting interest rates despite a robust economic backdrop because inflation excluding factors like shelter is already near target and the job market is effectively stalled, former IMF economist Gerwin Bell told MNI. {NSN T8R4IB6QRTHC <GO>}
- The BBDXY Average True Range for the last 10 Trading days: 339 Points
Fig 1: BBDXY Daily Chart
Source: MNI - Market News/Bloomberg Finance L.P
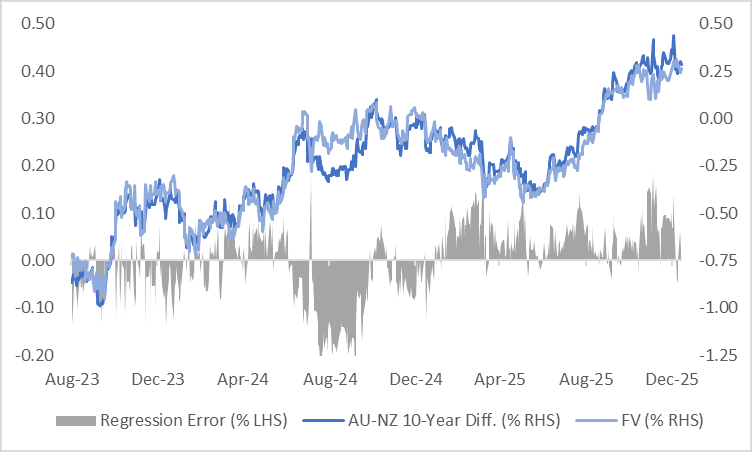
AUSSIE BONDS: AU-NZ10Y Diff Hovering Just Below Highs
The AU–NZ 10-year yield differential currently sits at +29bps, around 10bps below its recent peak of approximately +40bps, the widest since October 2020.
- The widening in the long-end spread has been mirrored by shifts in market expectations for the policy rate differential over the next year, as reflected in the AU–NZ 1-year forward 3-month swap (1Y3M) spread.
- Markets are presently pricing a 10-15bp narrowing of the AU–NZ 3-month rate spread over the next 12 months.
- Our Economics team’s central view is that both the RBA and the RBNZ are most likely to leave policy rates unchanged over the coming year.
- A simple regression analysis of the AU-NZ 10-year yield differential against the AU-NZ 1Y3M spread over the past two years shows that the 10-year differential is around 2bps above fair value based on the regression model.
Figure 1: AU-NZ: 10-Year Yield Differential Vs. FV
Source: Bloomberg Finance LP / MNI