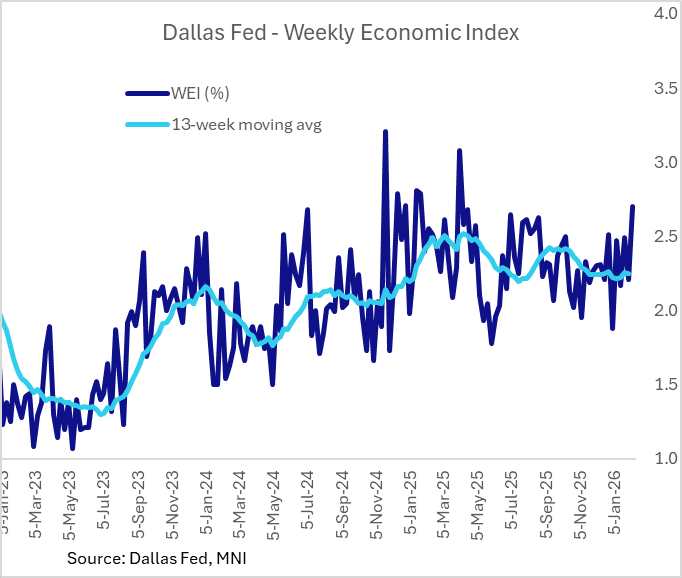
US DATA: Dallas Fed WEI Surges In Latest Week, Still Points To Q1 GDP Cooldown
The Dallas Fed's Weekly Economic Index surged in the week of Feb 7, posting 2.70% growth (scaled to 4-quarter growth), up from 2.21% in the prior week and the highest since early April 2025. That in turn lifted the 13-week (ie quarterly) moving average to 2.31% from 2.25%, for the highest in over 3 months.
- That's strong, but unless it can keep up that weekly pace of gains as a Y/Y measure the 13-week average roughly tracking a 1% Q/Q SAAR growth rate for Q1 2026 so far (assuming the Atlanta Fed's 3.7% Q/Q SAAR GDP estimate is correct for Q4 2025, which is equivalent to 2.8% growth).
- The WEI appears to track domestic demand better than overall GDP; WEI was consistently below the GDPNow estimate for Q4 which easily exceeded 5+% Q/Q SAAR at one point but now looks to have come in well below that. And when stripping out inventories and net exports, the WEI looks to have been right on target in Q4, with growth in the low-to-mid-2% SAAR.
- A reminder of the WEI's inputs: "To measure consumer behavior, we include the Redbook same-store retail sales index and the Rasmussen Consumer Index. To measure labor market conditions, we include initial and continuing unemployment insurance claims, the American Staffing Association Index of temporary and contract employment, and federal tax withholding data from Booth Financial Consulting. For production, we include U.S. steel production from the American Iron and Steel Institute, U.S. electricity output data from the Edison Electric Institute, a measure of fuel sales based on Energy Information Administration data, and total railroad traffic from the Association of American Railroads."
Want to read more?
Find more articles and bullets on these widgets:
Historical bullets
US TSYS: Late Treasury Roundup: Deciphering December CPI Inflation Data
- Treasuries look to finish higher Tuesday - but well off this morning's knee-jerk post-CPI data highs as markets continue to digest multiple anomalies in the data set stemming from a reversal of November holiday sale discounting for goods products, along with sampling issues from the use of bimonthly metro area surveys (with no October data for comparison due to no survey that month).
- Currently, TYH6 trades +4 at 112-08.5 vs. 112-14 high, key short-term resistance is unchanged at 112-31, the Dec 18 high. 10Y yield -.0078 at 4.1674%.
- The range of significant anomalies on both ends of the table in the December data, and even within categories, has little obvious pattern, making the signal difficult to discern other than that the report overall should be taken with some caution.
- Within the core categories, the big surprise was that there was zero inflation in core goods prices despite anticipation that there would be "payback" in particular for unusually low holiday sales-related goods prices in November (along with continued expectations of tariff passthrough).
- Dollar strength has been most notable against the yen on Tuesday, with an impressive pre-data rally overnight consolidating post release as the domestic political backdrop in Japan continues to weigh on yen sentiment.
- Look ahead: tomorrow's data includes PPI, Retail Sales and Existing Home Sales data. Bank earnings resume tomorrow: Bank of America, Wells Fargo and Citigroup on Wednesday, Goldman Sachs, Blackrock and Morgan Stanley on Thursday.
US TSY FUTURES: BLOCK: Mar'26 2Y Sale
-5,000 TUH6 104-08.37, post time bid at 1503:21ET, DV01 $191,000.
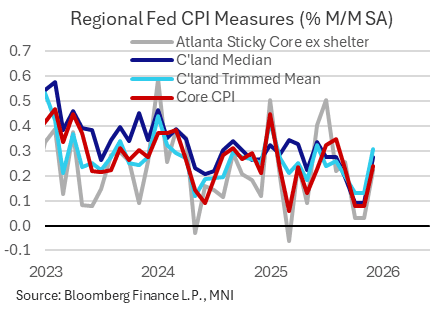
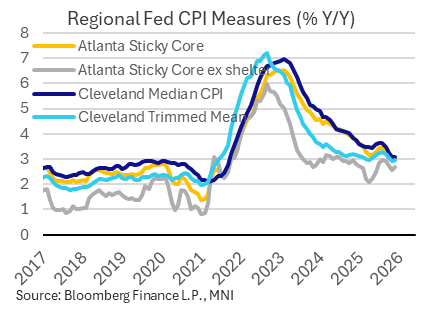
US DATA: Narrower Atlanta, Cleveland Fed Inflation Metrics Pick Up In December
December's post-CPI reads by the Cleveland and Atlanta Feds showed a reversion to more typical median and "sticky" inflation rates after the distorted October/November data. In other words, there was some largely as-expected upside payback from the artificially soft readings in November, though the latest rates appear to be largely in line with the inflation pace seen in mid-year - suggesting only limited further disinflationary progress in breadth metrics at the end of the year.
- The M/M Cleveland Fed median picked up to 0.28% after 0.09% prior, in line with the figure seen in both July and August (and slightly higher than September's 0.20%), leaving the Y/Y rate fairly steady at 3.08%, lowest since Q3 2021. But the 16% trimmed mean figure roared back, up 0.31% M/M for the highest since June, and the Y/Y measure picking up to 2.95% after 2.90% prior.
- Meanwhile the Atlanta Fed's Sticky CPI ex-shelter rate picked up to aa 6-month high 0.29%, as the Y/Y run rate ticked up to a 3-month high 2.87%. Similarly, sticky core CPI ex-shelter rose to a 3-month high 0.22%, with Y/Y up 0.1pp to 2.67%. These paint a softer picture of underlying inflationary pressures on a 6-month annualized rate basis, down to 1.15% for sticky core ex-shelter (lowest since May).
- These analyses are further to MNI's analysis showing that the breadth of inflation pressures increased, led by core goods. 41% of ~190 items across the CPI basket saw price increases of 3% Y/Y or higher in December, up from 36% in Nov and 40% in Sep.