EURJPY TECHS: Corrective Pullback Extends
- RES 4: 149.46 1.382 proj of the May 12 - Jun 28 - Aug 2 price swing
- RES 3: 148.88 High Dec 9 2014
- RES 2: 148.40/45 High Oct 21 and the bull trigger / High Dec 15 2014
- RES 1: 147.75 High Oct 31
- PRICE: 144.60 @ 15:49 GMT Nov 3
- SUP 1: 143.80 Low Oct 24 and key support
- SUP 2: 143.26 50-day EMA
- SUP 3: 141.78 Low Oct 13
- SUP 4: 140.90 Low Oct 10
EURJPY maintains this week’s softer tone and price has traded below the 20-day EMA. The outlook is bullish and key support to watch lies at 143.80, Oct 24 low. A break would suggest scope for a deeper pullback. Key resistance is unchanged at 148.40, the Oct 21 high. Clearance of this hurdle would confirm a resumption of the uptrend and open 149.46, a Fibonacci retracement. MA studies are in a bull mode position highlighting an uptrend.
Want to read more?
Find more articles and bullets on these widgets:
Historical bullets
USDCAD TECHS: Pulls Back From Its Recent Highs
- RES 4: 1.4000 Psychological round number
- RES 3: 1.3970 3.236 proj of the Aug 25 - Sep 7 - 13 price swing
- RES 2: 1.3896 3.00 proj of the Aug 25 - Sep 7 - 13 price swing
- RES 1: 1.3838 High Sep 30 and the bull trigger
- PRICE: 1.3606 @ 15:37 BST Oct 4
- SUP 1: 1.3560 Low Sep 26
- SUP 2: 1.3443 20-day EMA
- SUP 3: 1.3358 Low Sep 21
- SUP 4: 1.3212 50-day EMA
USDCAD has pulled back from its recent highs. The move lower highlights a short-term reversal and potential for a deeper corrective pullback. This is seen as a long overdue retracement and is allowing an overbought reading in the trend to unwind. Attention is on the next firm support at 1.3443, the 20-day EMA. A break would strengthen bearish conditions. Key resistance and the bull trigger, has been defined at 1.3838, the Sep 30 high.
STOCKS: S&P E-minis Sit Shy Of Next Resistance As Real Yield Decline Pauses
- ESZ2 hit session highs of 3802.5 following softer than expected JOLTS openings and has held close to it ever since with real yields moving off session lows.
- It hovers further below next resistance at the 20-day EMA of 3816.53 following an extension of the important short-term reversal after yesterday’s candle pattern was a bullish engulfing line.
- As has been the case for some time, US real yields continue to dominate, with the 10Y real is -7bps for -30bp over two days in a sharp reversal of a similarly sized climb late last week.
- SPX is up 2.7%, led by energy (+4.0%), financials (+3.5%) and materials (+3.5%) with consumer staples (+1.1%) and real estate (+1.4%) lagging. NASDAQ sees modest outperformance with +3.1%.
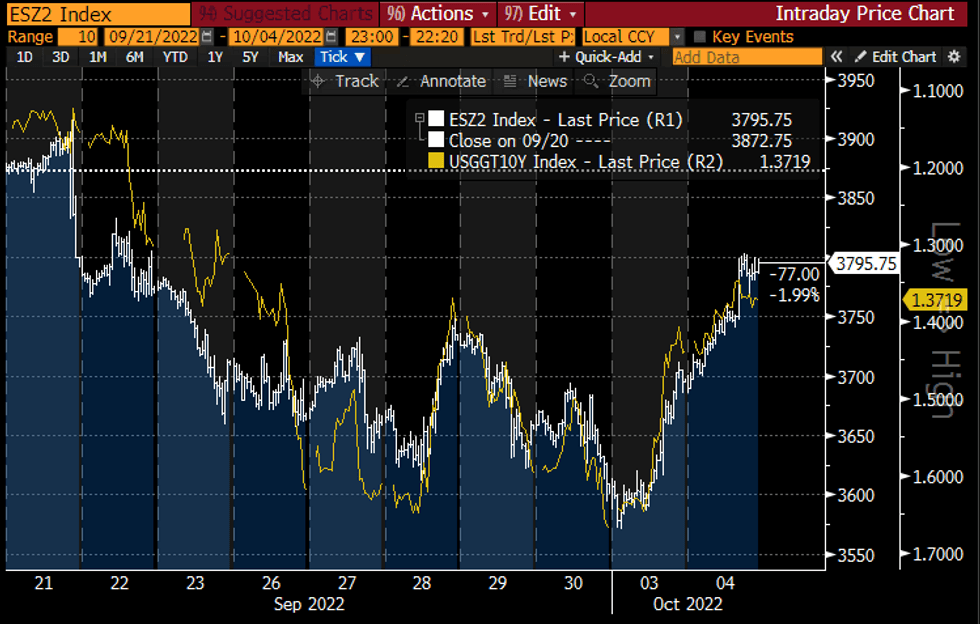 ESZ2 (white) and inverted US 10Y real yield (yellow)Source: Bloomberg
AUDUSD TECHS: Bear Flag
- RES 4: 0.6770 50-day EMA
- RES 3: 0.6671 High Sep 22
- RES 2: 0.6621 20-day EMA
- RES 1: 0.6550 High Sep 26
- PRICE: 0.6506 @ 15:35 BST Oct 4
- SUP 1: 0.6363 Low Sep 28 and the bear trigger
- SUP 2: 0.6337 Low Apr 24 2020
- SUP 3: 0.6283 Low Apr 23 2020
- SUP 4: 0.6255 1.236 proj of the Apr 5 - May 12 - Jun 3 price swing
AUDUSD is consolidating and this pause in the downtrend appears to be a bear flag, reinforcing bearish trend conditions. The recent break of support at 0.6682, Jul 14 low and a bear trigger strengthened the bearish case and this maintains the broader downward price sequence of lower lows and lower highs. The focus is on 0.6337 next, the Apr 24 2020 low. Initial firm resistance has been defined at 0.6621, the 20-day EMA.