US DATA: Core Durable Goods Solidifying After Volatile Period
Sep-25 13:23
Durable and capital goods orders exceeded expectations in August.
- Headline orders came in at 2.9% M/M, besting the expected 0.3% contraction and reversing August's 2.7% fall (rev from a 2.8% drop). As is more often the case than not, aircraft orders volatility played a key role here, though it wasn't just the usual nondefense aircraft & parts (i.e. Boeing) orders which rose 22% after -32%, with defense aircraft/parts jumping 50% to the highest level in 28 months.
- Nonetheless, ex-transport durable goods orders also exceeded expectations, rising 0.4% M/M (0.0% expected, 1.0% prior unrevised).
- And the key core indicator, nondefense/ex-aircraft capital goods orders, rose 0.6% (0% expected, 0.8% prior rev from 1.1%).
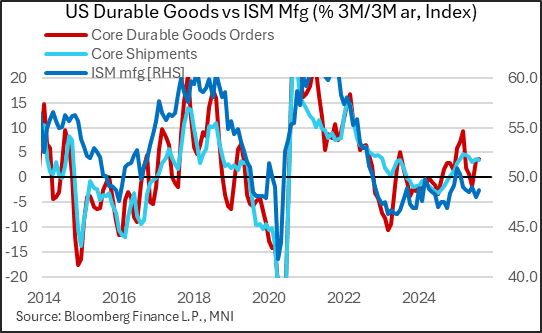
- After pulling back over the summer, momentum is starting to rebuild for core capital capital goods orders: the 3M/3M annualized rate of growth is up to 3.7%, vs flat/contractionary in May/June and the fastest since Q1's tariff front-loaded activity.
- If you exclude Q1 which is arguably a distorted period to measure, this is some of the strongest momentum since 2023. Shipments have been on the softer side (-0.3% M/M in Aug), but that is more of a lagging indicator.
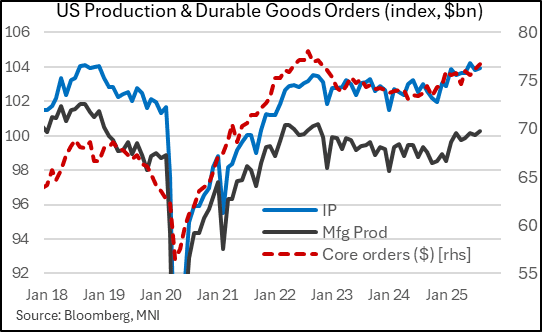
- Overall manufacturing and equipment investment appears to have steadied out, with the resumption of the uptrend appearing to resume in core durables and more broadly in IP/manufacturing production.
Want to read more?
Find more articles and bullets on these widgets:
Historical bullets
EGB OPTIONS: Schatz Call Spread
Aug-26 13:19
DUV5 107.30/107.50cs 1x2, bought for 1 in 1k.
US DATA: Something For Everyone In Philly Survey, But Inflationary Either Way
Aug-26 13:14
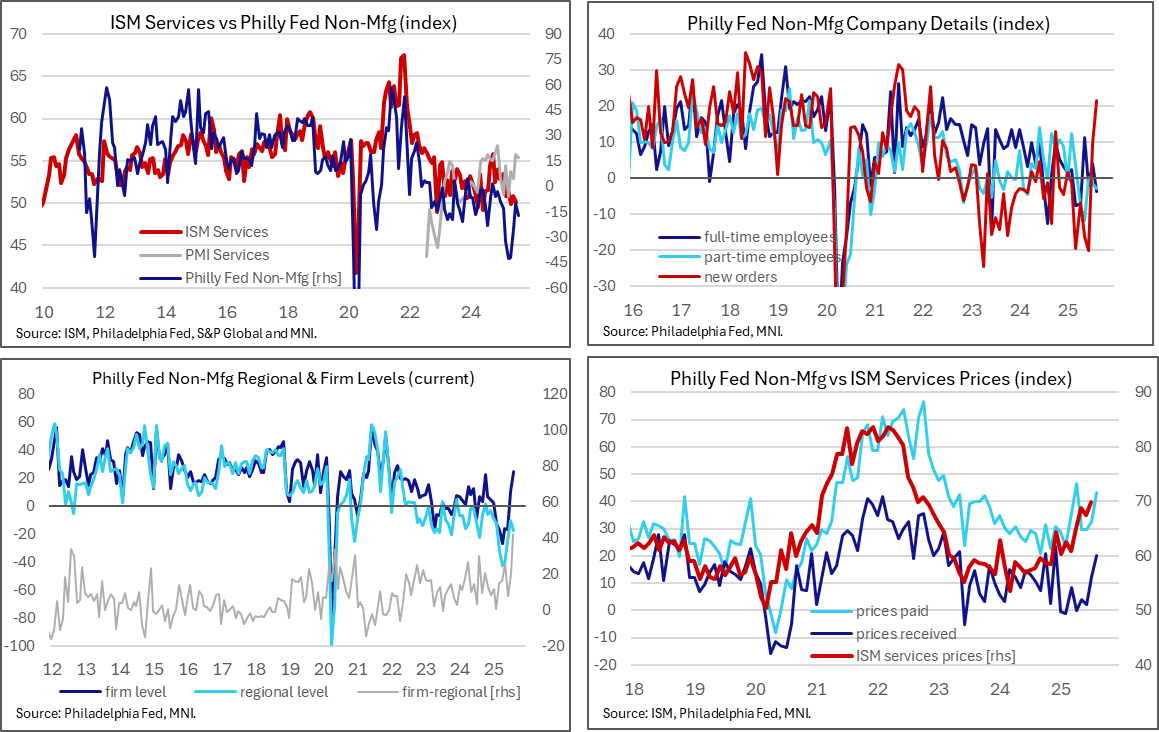
The Philly Fed non-manufacturing survey pointed to a stagflationary environment when taking firms' views on the regional economy or an outright inflationary environment when focusing on their own firm-level activity. Own-level activity and new orders increased to their highest since Mar 2022 whilst prices received saw their highest since December.
- The Philly Fed non-manufacturing index slipped to -17.5 in August from -10.3 in July after the latter had been its least negative since January.
- However, this index, which appears on screens, is for the assessment of regional activity and it masks what has been a much stronger activity index when firms answer considering their own activity. This firm-level activity index rose from 10.2 to 24.6 for its highest since Mar 2022.
- It’s a new recent high in the discrepancy between firms own and regional activity, potentially a sign of uncertainty facing firms.
- This firm-level strength was helped by a 12pt rise in the new orders index to 21.5 (also highest since Mar 2022) whilst the sales/revenues index moved up 6pts to 17.5 (highest since October).
- Employment indexes weren’t as encouraging however, with the full-time index falling 8pts to -3.8 as it continued a pattern of alternating between positive and negative readings. 62% of firms reported no change in employment. The average workweek index did however rise 5pts to 17.3 for a third consecutive positive reading.
- Price indexes “suggest widespread increases in prices for inputs and for the firms’ own goods and services overall.” Prices paid increase 11pts to 43.2 (highest since April) whilst prices for the firms’ own prices received index increased 8pts to 20.1 (highest since December).
- As for six-month ahead indexes, the regional activity index did at least increase from -3.9 to 1.3 for its first positive reading since January having troughed at -31.8 in April. The firm-level index meanwhile increased to 21.2 (also highest since Jan) after three months in a narrow range between 11.6-12.3.
- Survey responses collected from Aug 11-21.
MNI: US Q2 FHFA HPI Q/Q SA -0.0% V +2.9% Q2 2024
Aug-26 13:00
- MNI: US Q2 FHFA HPI Q/Q SA -0.0% V +2.9% Q2 2024