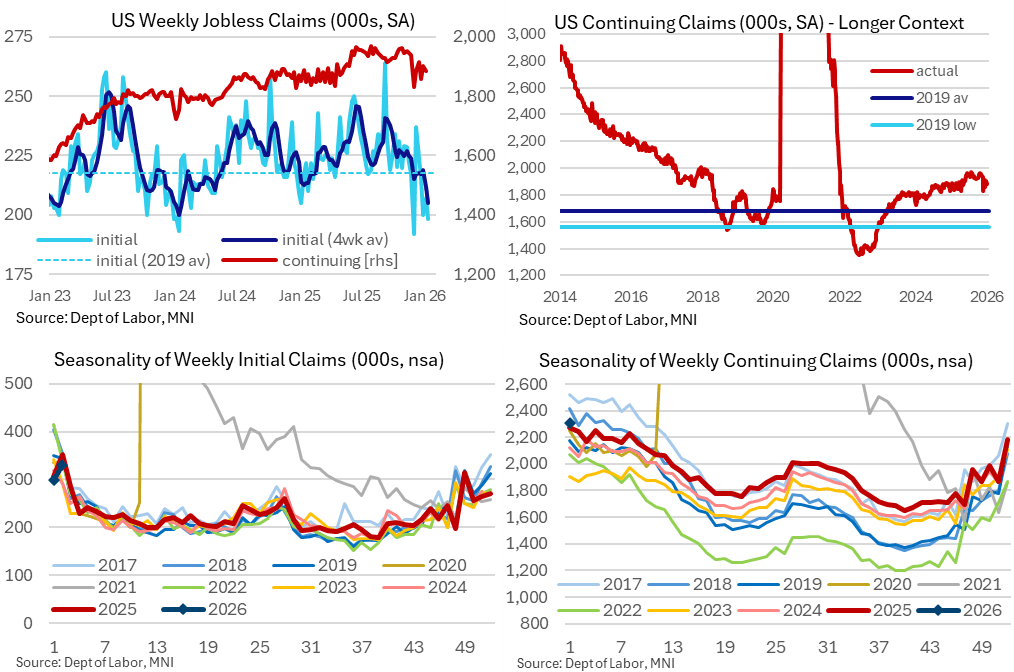
US DATA: Claims Point To (Particularly) Low Firing and Low Hiring Jobs Market
Initial jobless claims surprised lower for a fifth consecutive week. There are residual seasonality concerns, which could see increases heading into February, but it was still left one of the lowest single weekly readings of recent years and the lowest four-week average since Jan 2024. Continuing claims continue to hold their easing back from cycle highs seen through Jun-Oct.
- Initial claims came in at just 198k (sa, cons 215k) in the week to Jan 10 after a marginally downward revised 207k (initial 208k) in the previous week.
- Aside from the seemingly Thanksgiving-distorted 192k in late Nov, this is the lowest seasonally adjusted single week for initial claims since early 2024 and before that Sep 2022.
- The four-week average fell to 205k vs 219k just two weeks prior, for its lowest since Jan 2024. These are historically low levels – they averaged 218k through 2019 with a sub-4% u/e rate, although re-hiring is currently clearly softer – but there still appears to be residual seasonality that points to increases heading into February (see top left chart).
- The non-seasonally adjusted level of initial claims increased 32k to 331k vs a 46k increase to 352k in a broadly similar period in 2025, but comparisons with prior years are complicated by how weeks fell around the turn of the year.
- Continuing claims also surprised lower at 1884k (sa, cons 1897k) in the week to Jan 3 after a downward revised 1903k (initial 1914k)
- Whilst still two weeks away from covering the January payrolls reference period, they’re currently tracking below the 1914k for Dec which had already compared broadly favorably to the 1944k in Nov, 1957k in Oct, 1916k in Sep and 1944k in Aug.
Want to read more?
Find more articles and bullets on these widgets:
Historical bullets
US 10YR FUTURE TECHS: (H6) Bearish Outlook
- RES 4: 113-09 76.4% retracement of the Nov 25 - Dec 10 bear leg
- RES 3: 113-00+ 61.8% retracement of the Nov 25 - Dec 10 bear leg
- RES 2: 112-27+ High Dec 5
- RES 1: 112-23 High Dec 11
- PRICE: 112-11+ @ 13:50 GMT Dec 16
- SUP 1: 111-29 Low Dec 10 and the bear trigger
- SUP 2: 111-19 1.236 proj of the Oct 17 - Nov 5 - 25 price swing
- SUP 3: 111-11 1.382 proj of the Oct 17 - Nov 5 - 25 price swing
- SUP 4: 111-00 Round number support
A bear theme in Treasuries remains intact. Today’s volatile activity resulted in a brief test above the 20-day EMA, at 112-20. The outlook remains bearish. A continuation lower would refocus attention on key support at 111-29, the Dec 10 low. Clearance of this level would confirm a resumption of the bear leg and open 111-19, a Fibonacci projection. On the upside, a clear breach of 112-23, the Dec 12 high would strengthen a S/T bull cycle.
US TSY OPTIONS: Post-Open/Data Trade
Derivatives trade turns mixed with underlying rejecting post-data knee-jerk bid, TYH6 back in overnight range at 112-11 (+2) vs. 112-22.5 high - briefly through 20-day EMA at 112-20. Projected rate cut pricing gaining cool slightly vs. early morning levels (*): Jan'26 steady at -6.1bp, Mar'26 at -13.5bp (-14.3bp), Apr'26 at -20.6bp (-20.8bp), Jun'26 at -34.5bp (-34.2bp).
- 5,000 TYF6 113/113.5 1x2 call spds ref 112-11
- 6,000 TYG6 111/112/113 2x3x1 put flys ref 112-12.5
- +12,000 Weds Wkly 10Y 112 puts, 6-7
- -8,000 TYG6/TYH6 112.5 straddle spd, 33 vs. 112-09.5
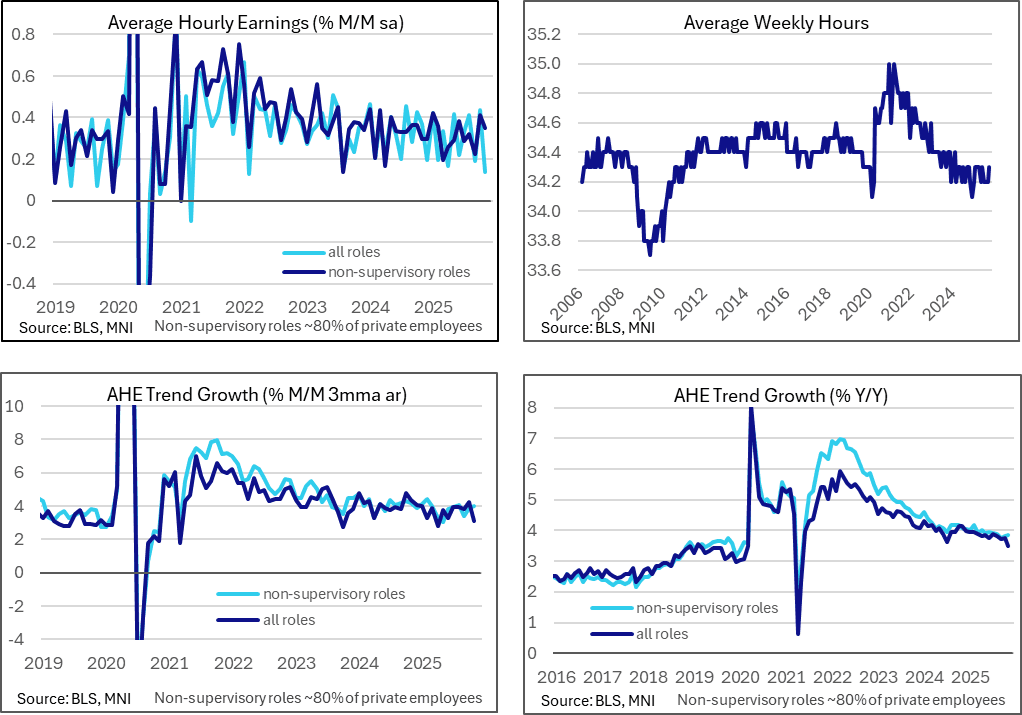
US DATA: AHE A Mixed Bag Rather Than A Clear Miss In Two-Month Update
The two months of average hourly earnings data were a mixed bag rather than the outright weakness that the headlines suggest, with non-supervisory employee wage growth running firmer and hours worked also increasing in November.
- Overall AHE growth of 0.14% M/M in November was clearly softer than the 0.3% M/M widely expected although it was countered by a stronger than expected 0.44% M/M in Oct (we had seen limited estimates with a median 0.3 but with risks skewed lower). Still, September was also revised lower to 0.19% M/M vs the previously estimated 0.25% M/M.
- The combination meant the Y/Y rate surprised lower, with 3.51% Y/Y (cons 3.6) after 3.75% in Oct for a fresh low since May 2021.
- Non-supervisory earnings painted a stronger picture however, at 0.35% M/M in Nov after 0.41% M/M in Oct and only a marginally downward revised 0.22% (initial 0.25%) in Sep.
- This typically less volatile category that captures about 80% of employees accelerated to a three-month high of 3.86% Y/Y from 3.81%.
- Another factor that makes the headline AHE figures look less weak is that average hours worked surprised higher in November at 34.3 (cons 34.2) after the 34.2 was unchanged from the previously reported 34.2 in September. This would mechanically have biased average hourly earnings of salaried employees lower in the month.