OPTIONS: Call Spread Buying Prevalent In Sonia To Close The Week
Feb-13 17:53
Friday's Europe rates/bond options flow included:
- RXJ6 126/125ps, bought for 7 in 2k
- 0RM6 97.62/98.25RR, bought the call for -0.5 (receive) in 5k (ref 97.915, 30del)
- SFIJ6 96.70/96.75cs, bought for 0.75 in 9.5k
- SFIK6 96.70/96.75cs, bought for 0.75 in 5.5k
- SFIZ6 96.90/97.00cs vs 96.30/96.20ps, bought the cs for 2 in 3k
Want to read more?
Find more articles and bullets on these widgets:
Historical bullets
OPTIONS: Upside Plays Dominate Wednesday
Jan-14 17:52
Wednesday's Europe rates/bond options flow included:
- ERM6 97.93c, bought for 6 in 3.6k
- ERZ6 98.125/98.4375/98.50/98.8125 call condor, paper pays 4 in 10k
- ERZ6 98.12/98.4375/98.50/98.8125c condor vs 97.4375p, bought the condor for 1.75 in 10k. This was also bought Tuesday for 1.25 and 1.5 in 10k
- 0RG6 97.9375/97.875/97.8125 put fly, bought for 2 in 20k
- 0RH6 98.00/97.93/97.87/97.62p condor 2x1x3x2, bought for 3.75 in 8k x 4k x 12k x 8k
- SFIG6 96.40/96.35ps 1x2, bought for 1.25 in 5k
- SFIH6 96.45^, sold at 8.75 in 1.5k
- SFIM6 96.80/96.95 call spread, paper pays 1 for 11k all day
- SFIM6 96.65/96.85/97.05c fly, bought for 3.25 in 10k
- SFIM6 96.55/96.65/96.75c fly, bought for 1.5 in 4k
- SFIM6 96.80/96.95cs, bought for 1 in 5k2
US TSY OPTIONS: BLOCKs: 10Y Vol Sale, 30Y Calendar Spreads
Jan-14 17:44
- Block, +10,000 USH6 111/USJ6 109 put spds, 7 at 1234:14ET
- Block, +10,000 USH6 123/USJ6 121 call spds, 17 at 1234:07ET
- Blocks, -20,546 TYJ6 111/113.5 strangles, 46 from 1232-1233ET
US DATA: Current Account Deficit Surprises Lower With Extra Boost From Incomes
Jan-14 17:43
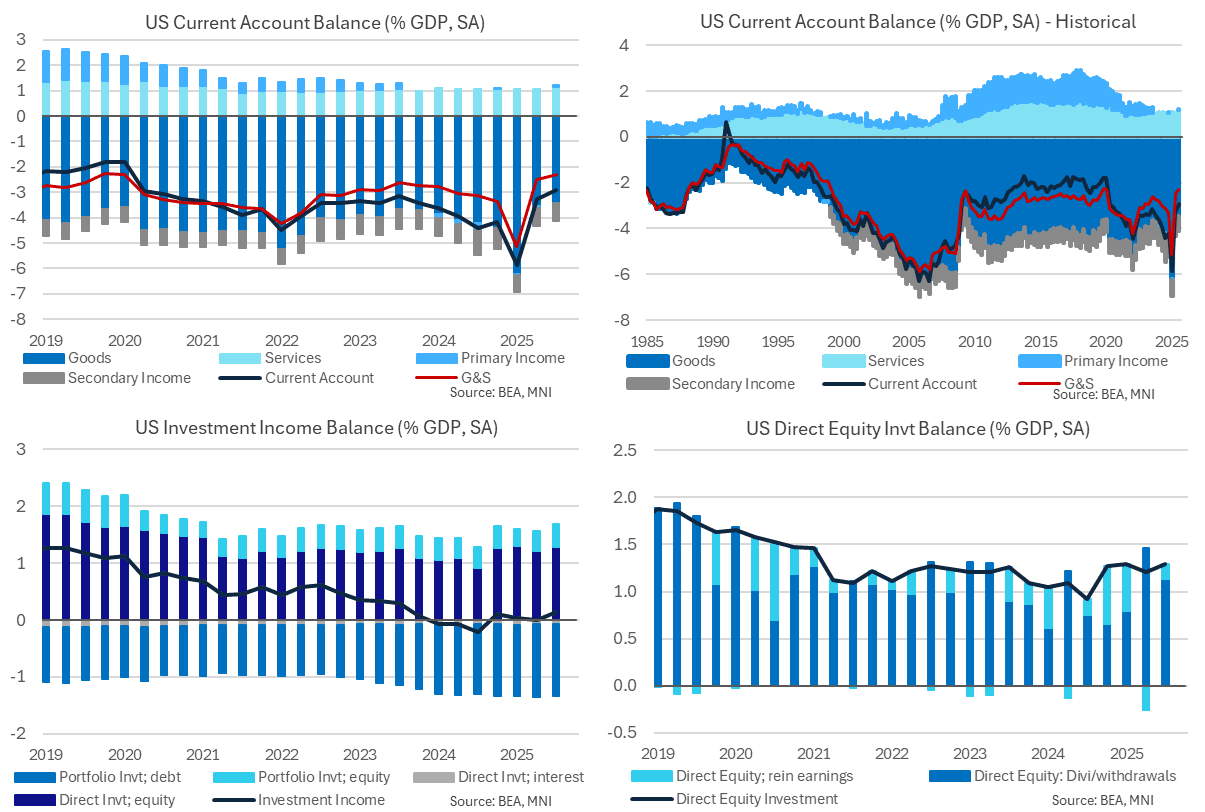
Q3 current account data saw a smaller than expected deficit in Q3 at 2.9% GDP after 3.3% GDP in Q2, with the surprise coming from higher investment income. It's the smallest quarterly current account deficit since 2020 whilst the details confirmed a goods trade deficit at 3.4% GDP in Q3 for its smallest quarterly deficit since 2009 as President Trump noted ahead of the release. Add in services trade data also available for October and we’re tracking at the lowest broader trade surpluses since the late 1990s according to latest data.
- The current account deficit narrowed by more than expected in Q3 to $226.4bn (cons $238bn) from $249bn in Q2.
- The goods & services trade deficit narrowed from $189.8bn to $178.2bn as monthly data had already showed. The surprise instead came from primary income switching to its largest surplus in nominal terms since 3Q23, at $5.2bn vs a deficit of $5.8bn in Q2 (mainly on higher direct investment equity receipts but also from higher portfolio equity flows).
- It translates to a current account deficit of 2.9% GDP in Q3 (smallest since 1Q20) after 3.3% GDP in Q2, 5.9% GDP in Q1 and an average of 4.0% in 2024.
- The goods-only trade surplus saw a small narrowing on the quarter to 3.4% GDP (-0.1pp), which as Trump noted before the release was its smallest quarterly deficit since 2009.
- The broader goods & service trade surplus shows broadly similar trends, at 2.3% GDP for its joint smallest since 4Q19-1Q20 and 2Q09. It follows 2.5% GDP in Q2, 5.1% GDP in Q1 and an average 3.1% GDP in 2024.
- As part of Trump’s remarks on the deficit “going even lower”, we summarized after last week's October release, with its boost from higher gold exports and lower pharma imports, that this goods & services trade deficit has since shrunk to just 1.7% GDP on a three-month rolling basis for its smallest since the late 1990s.
- Elsewhere, the primary income surplus was worth 0.1% GDP in Q3 (+0.2pps) whilst the secondary income deficit held steady at 0.7% GDP for a third quarter.