UK DATA: BRC Footfall Worst Since Early 2025, Likely Boosted Online Store Sales
UK footfall declined 4.7% Y/Y in February, down notably from -0.6% Y/Y in January (which was the highest since last August) - with wet weather highlighted as the key driver. The February reading is the weakest since March 2025, slightly dampening the early signs of the retail sector's bounce back from a relatively poor Q4 2025. Still, we note that recent hard retail sales data has been on the stronger side - but this release may present some downside risk to upcoming data.
- Comments from the press release: "One of the wettest Februarys on record saw shoppers shy away from in store visits last month ... a blow felt most keenly by clothing and footwear retailers."
- "February proved a more challenging month for UK retail, with footfall slipping further into decline and reversing the tentative progress seen in January. Exceptionally heavy rainfall - well above the seasonal average ... [drove] a natural shift towards online shopping as consumers chose convenience and shelter from the downpours."
- Footfall fell in all three location categories: shopping centres down 5.5% Y/Y (-0.8% Jan), high streets down 5.4% Y/Y (-1.9% Jan), and retail parks down 3.1% Y/Y (vs a 1.1% increase in Jan).
- The reporting period covers the four weeks 1 - 28 Feb 2026, the same as next Tuesday's BRC retail sales, and the official ONS retail sales data (due Fri 27th March).
- We saw a strong upside surprise in the ONS's Jan retail sales (1.8% M/M vs 0.2% cons, 0.4% Dec), after positive signals from the BRC's Jan retail sales.
- While today's footfall data is surprisingly weak, we would be cautious in translating into implications for the ONS data, given the split of online and physical store sales. Wet weather likely shifted sales to online stores as opposed to removing them completely - which we will be watching in the upcoming retail sales releases from both the BRC and ONS.
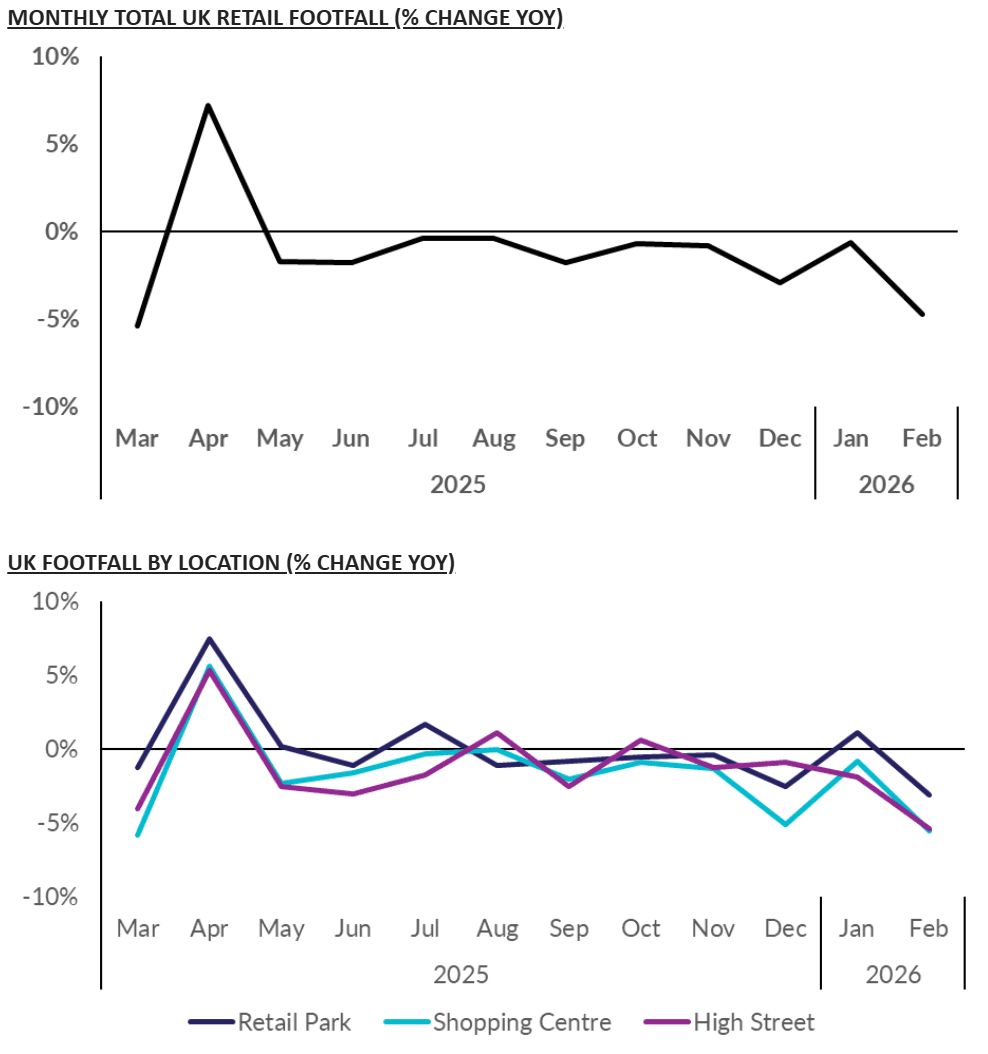
Chart source: BRC-Sensormatic Footfall Monitor
Want to read more?
Find more articles and bullets on these widgets:
Historical bullets
US STOCKS: S&P(ESH6) - Another Rejection Above 7000
The S&P(ESH6) overnight range was 68886.25 - 7027.25, SPX closed -0.84%, Asia is currently trading around 6940. The S&P(ESH6) has again failed miserably back above 7000 falling very quickly as the rotation out of Tech stocks seem to be picking up. The price action considering most of these tech stocks beat earnings is not great. I am not calling for any correction until I see the move lower actually unfold as there have been too many false starts to even mention over the last few weeks. February though is typically not a good month for stocks based on seasonality, and with the market stretched and some warning lights flicking on the AI trade it is worth being prudent. This morning futures have opened slightly lower, E-minis(S&P) -0.05%%, NQZ5 -0.15%. On the day, the first support is back toward the 6850-6880 area if this support breaks it could signal a deeper pullback toward the 6700-6750 area.
- EndGame Macro on X: “Once you account for the recurring liquidity squeeze that shows up ahead of tax season, when billions are pulled out to meet obligations and crowded trades get caught flat footed, it’s difficult to argue that any rally before April is more than hopeful optimism.”
- Fejau on X: “What happens to market structure when MAG7 buybacks disappear this year? I think diversifying out of megacap tech is an important theme to consider this year.” See Fig.1
- Buybacks have been a huge factor in dips consistently being supported this is an important point being made that this buying is going to be greatly reduced going forward due to AI Capex.
- The S&P 500 Index Average True Range(ATR) for the last 10 Trading days: 82 Points
Fig 1: META Buybacks vs CapEx
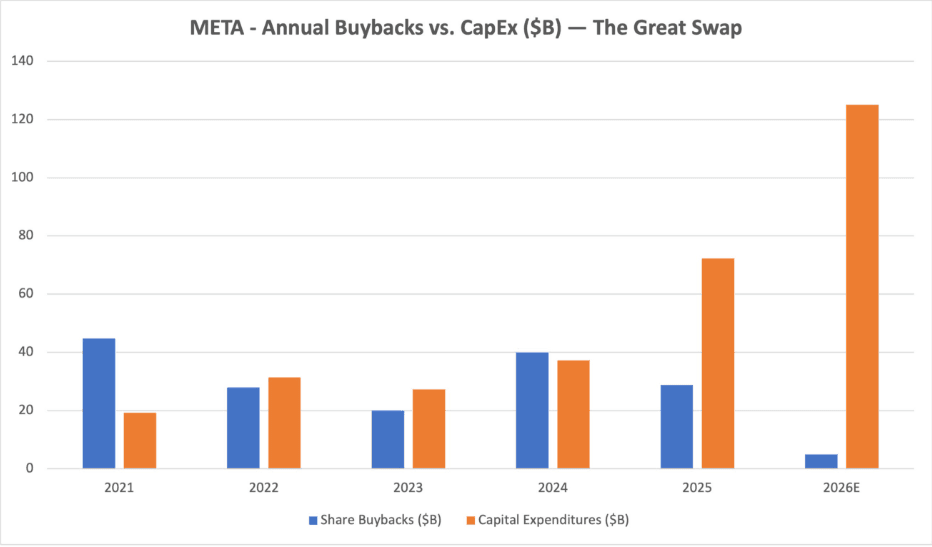
Source: MNI - Market News/@fejau_inc
AUSSIE BONDS: Oct-36 Supply Faces A Higher Yield But Flatter Curve
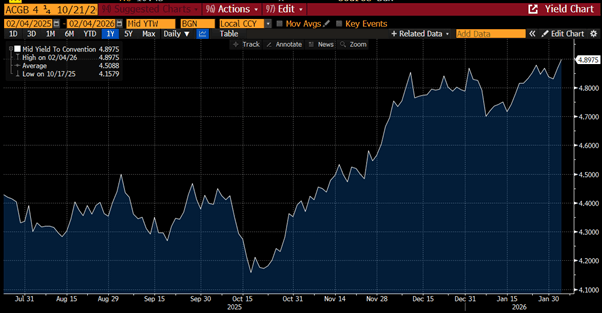
The Australian Office of Financial Management (AOFM) will today sell A$1200mn of the 4.25% 21 October 2036 Treasury Bond. The line was last sold on 14 January 2026 for A$1000mn. Several key factors will likely shape investor demand at today’s auction:
- The bond’s outright yield is ~15bps higher than the prior auction and sits at its cycle high.
- Sentiment toward longer-dated global bonds remained wary, which may weigh on demand.
- The 3/10 yield curve is around its flattest level since late 2024, approximately 40bps flatter than at the time of its syndicated sale.
- Overall, pricing is expected to remain firm, underpinned by a stable yield profile and a more attractive curve backdrop.
- Results are due at 0000 GMT / 1100 AEST.
Bloomberg Finance LP
JGB TECHS: (H6) Bottom In?
- RES 3: 140.08 - High Jun 13
- RES 2: 139.05 - High Aug 4
- RES 1: 137.30 - High Sep 8 and key short-term resistance
- PRICE: 131.42 @ 16:08 GMT Feb 03
- SUP 1: 130.94 - 2.0% Lower Bollinger Band
- SUP 2: 130.66 - Low Jan 19
- SUP 3: 130.12 - 1.0% 10-dma envelope
JGBs came under intense selling pressure last week on the back of weak demand at a 20y JGB auction and increased scrutiny of Japan’s fiscal health. Resultantly, prices traded to new pullback and cycle lows. This affirms the firm downtrend that’s dominated prices since mid-September, and prices will need to challenge resistance before signaling any broader reversal. The break below the Lower Bollinger Band at 130.94 was brief, with 130.12 envelope support below.